Bitcoin price extends retreat from $69K threshold as BTC bulls wait for safer entry
- Bitcoin price is testing the 200-day EMA for a second time this week.
- A breakout above $69,000 and holding there with stable price action can lead to a long.
- A retest of $68,000 followed by a healthy rejection can lead to a short toward $60,800.

Bitcoin (BTC) price directional bias is on the balance as it sits atop a critical support for the second day in a row. The pioneer cryptocurrency reacted to the speech of Federal Reserve chair Jerome Powell with an abysmal move that lasted only briefly before falling back to its initial lull.
Also Read: Markets may not see a new Bitcoin price ATH pre-halving unless $69K breaks
Cryptocurrency prices FAQs
Token launches like Arbitrum’s ARB airdrop and Optimism OP influence demand and adoption among market participants. Listings on crypto exchanges deepen the liquidity for an asset and add new participants to an asset’s network. This is typically bullish for a digital asset.
A hack is an event in which an attacker captures a large volume of the asset from a DeFi bridge or hot wallet of an exchange or any other crypto platform via exploits, bugs or other methods. The exploiter then transfers these tokens out of the exchange platforms to ultimately sell or swap the assets for other cryptocurrencies or stablecoins. Such events often involve an en masse panic triggering a sell-off in the affected assets.
Macroeconomic events like the US Federal Reserve’s decision on interest rates influence risk assets like Bitcoin, mainly through the direct impact they have on the US Dollar. An increase in interest rate typically negatively influences Bitcoin and altcoin prices, and vice versa. If the US Dollar index declines, risk assets and associated leverage for trading gets cheaper, in turn driving crypto prices higher.
Halvings are typically considered bullish events as they slash the block reward in half for miners, constricting the supply of the asset. At consistent demand if the supply reduces, the asset’s price climbs. This has been observed in Bitcoin and Litecoin.
Bitcoin bulls wait for safer entry
Bitcoin price has slipped below the support offered by a critical support level, the 200-day Exponential Moving Average (EMA) at $65,574. However, the breakdown is not decisive as the pioneer cryptocurrency continues to hold above one of two trendlines that have been pivotal in BTC action for over six months.
Analysts are watching this level with concern that if it gives in, it could lead to more losses. This was seen during the second half of January, giving way to as much as 10% in downside momentum. The expectation is that if it holds, it could precipitate a rebound.
The 200EMA on the #Bitcoin four-hour chart has been formidable support. Since early February, it has prevented #BTC from dropping further.
— Ali (@ali_charts) April 2, 2024
For this reason, I'm paying close attention to this level because if it holds, it guarantees a rebound, but if it breaks as it did in… pic.twitter.com/cnfruT9wUJ
With inflows from BTC ETFs back above water, the assumption is that the downside potential seen in the Bitcoin price is attributed to smart money looking to catch retail off guard. Other theories suggest that the dump in the BTC market comes as cat-themed tokens are peaking.
Meanwhile, Federal Reserve chair Jerome Powell has urged markets not to expect interest rate cuts until there is more confidence on inflation.
FED'S JEROME POWELL: DON'T THINK INFLATION IS REVERSING HIGHER, WOULD BE QUITE DISRUPTIVE
— Evan (@StockMKTNewz) April 3, 2024
Powell also noted that reducing rates too soon could result in a reversal of the progress seen on inflation so far:
Given the strength of the economy and progress on inflation so far, we have time to let the incoming data guide our decisions on policy. If the economy evolves broadly as we expect, most FOMC participants see it as likely to be appropriate to begin lowering the policy rate at some point this year.
In the immediate aftermath, Bitcoin price surged by 1% on concerns about inflation and, therefore, currency devaluation.
Bitcoin price prediction as 200-EMA remains critical
Bitcoin price action continues to maintain higher lows, while the Relative Strength Index (RSI) is showing lower lows. This is a typical hidden divergence, which could see BTC price drop before its potential leg up.
The position of the RSI below 50 is concerning, accentuated by the dwindling volumes of the Awesome Oscillator (AO). If Bitcoin price downtrend continues, a decisive slip below the 200-EMA, confirmed by BTC price moving below the upper trendline, would encourage more sell orders.
The ensuing selling pressure could see Bitcoin price test the $60,800 support, below which $60,000 would be imminent.
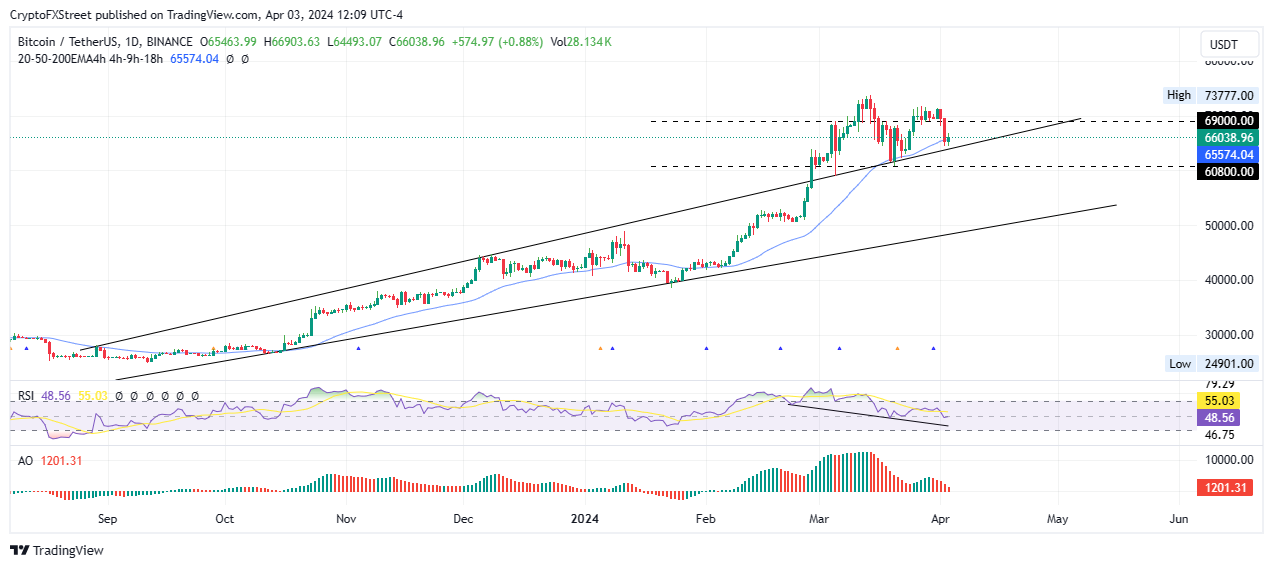
BTC/USDT 1-day chart
On the other hand, if the 200-EMA holds, it could provide the jumping-off point for Bitcoin price, sending it above the $69,000 threshold. If BTC bulls are able to hold above this level, it could initiate a continuation of the uptrend for BTC to reclaim the $73,777 peak before setting a new all-time high.
Author

Lockridge Okoth
FXStreet
Lockridge is a believer in the transformative power of crypto and the blockchain industry.



