Bitcoin price struggles below $27k while NASDAQ hits a 13-month high
- Bitcoin price is currently susceptible to further decline unless broader market cues turn bullish.
- BTC and NASDAQ now share a negative correlation of -0.44.
- NASDAQ managed to mark a 13-month high on June 1.

Bitcoin price has had a pretty good run since the beginning of the year despite its ups and downs, but one of the most notable achievements was its decoupling from the stock markets. Although BTC initially experienced benefits from this, the past few days may seem to hold a contrary viewpoint.
NASDAQ overtakes Bitcoin price
The stock market towards the end of 2022 observed heavy bearishness in the market, but Bitcoin price and the rest of the crypto market failed to realize a similar decline. This was the first sign of decoupling, which towards mid-April, turned negative. Since then, the two markets have shared a negative correlation, currently at -0.44.
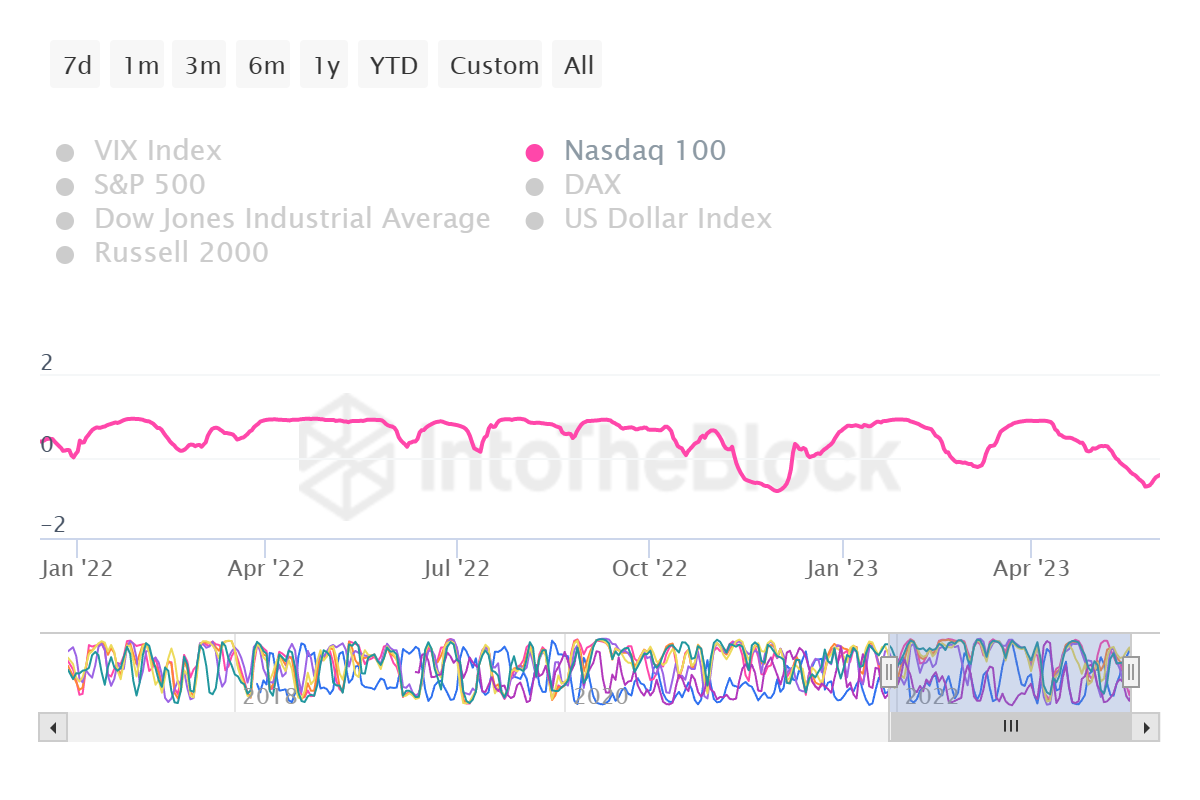
Bitcoin - NASDAQ correlation
Despite the concerns surrounding the debt ceiling last month, NASDAQ (NDX) has been observing an uptick. Come June 1, the stock market has grown by nearly 12%, in part mostly due to Nvidia. The chipmaker’s stock NVDA soared in value in the last couple of days, with the company’s market capitalization even hitting $1 trillion.
On the other hand, while the debt ceiling was raised, and the stock market seemed bullish at the time of writing, Bitcoin price did not follow suit. BTC investors and the broader market bearishness have increasingly undone a part of the March rally, which managed to pull Bitcoin price back up from $20,000 to $30,900 by mid-April.
But the decline since then has not only wiped out profits for a lot of the investors in the digital asset market but also pushed Bitcoin price down below $27,000. Trading at $26,730 at the time of writing, BTC is observing increasing uncertainty.
At the same time, NASDAQ has hit its highest point in the last 13 months. The last time NDX registered a closing level at the 14,441 points mark was back in April 2022. Thus while BTC kept slipping on the charts, the stock market index managed to note short-term records.
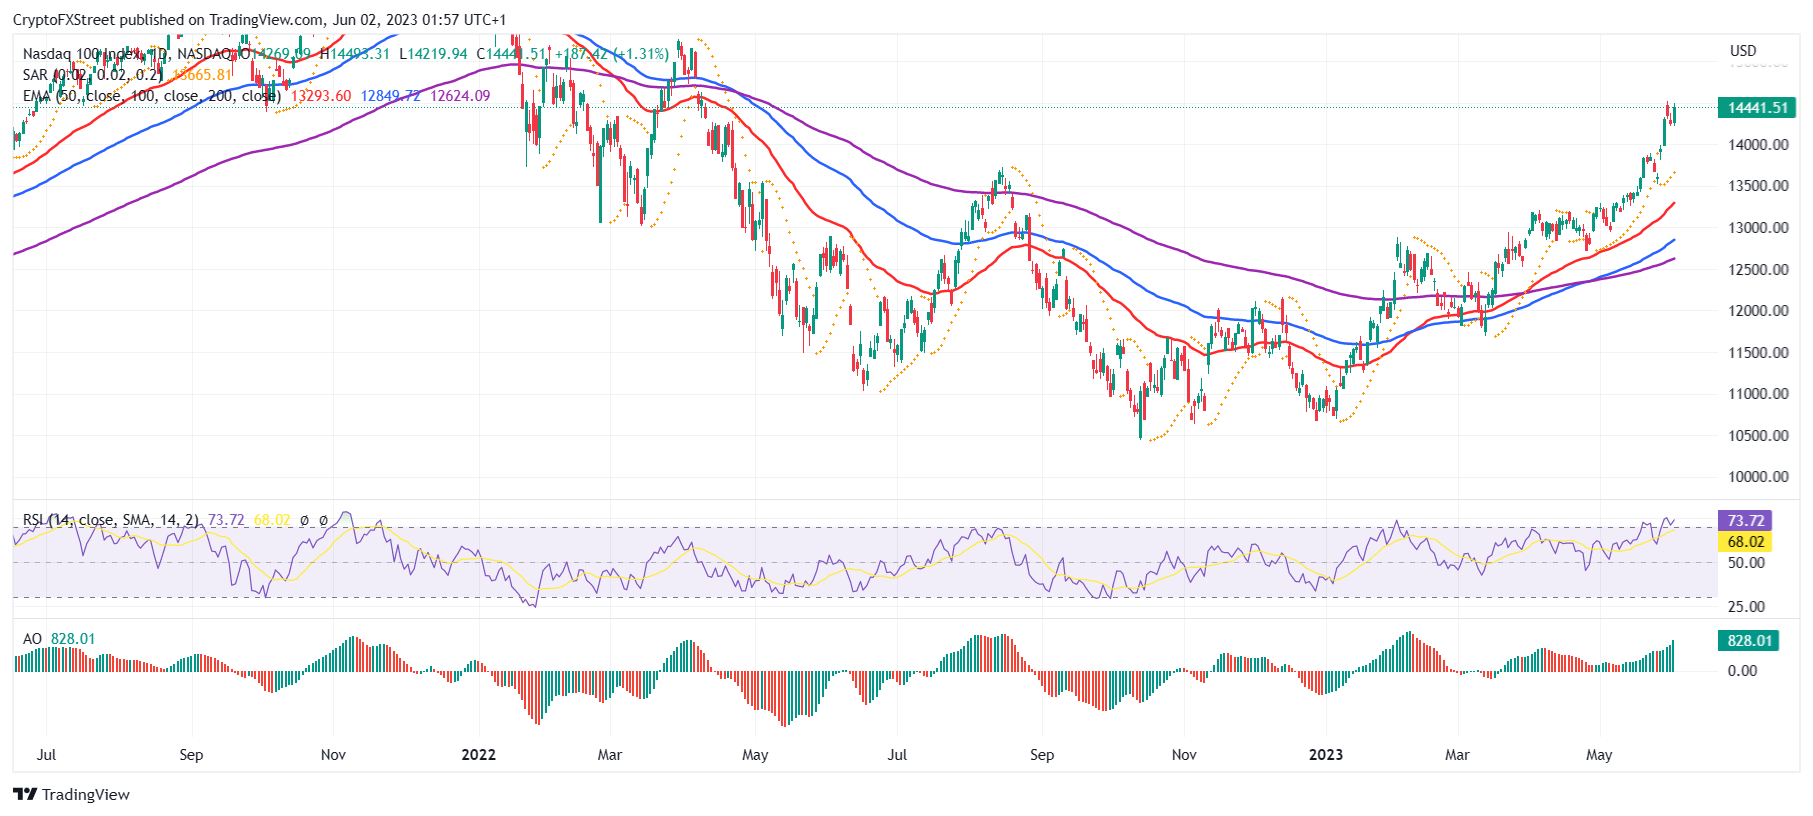
NASDAQ 1-day chart
This is explained by the negative correlation, which showcases the current conditions of both markets. As BTC continues to attempt a recovery to climb above $30,000, it will find a barrier at the $28,745 mark, which has been a multiple times tested support as well as a resistance level. Flipping it into a support floor would enable a further rise.
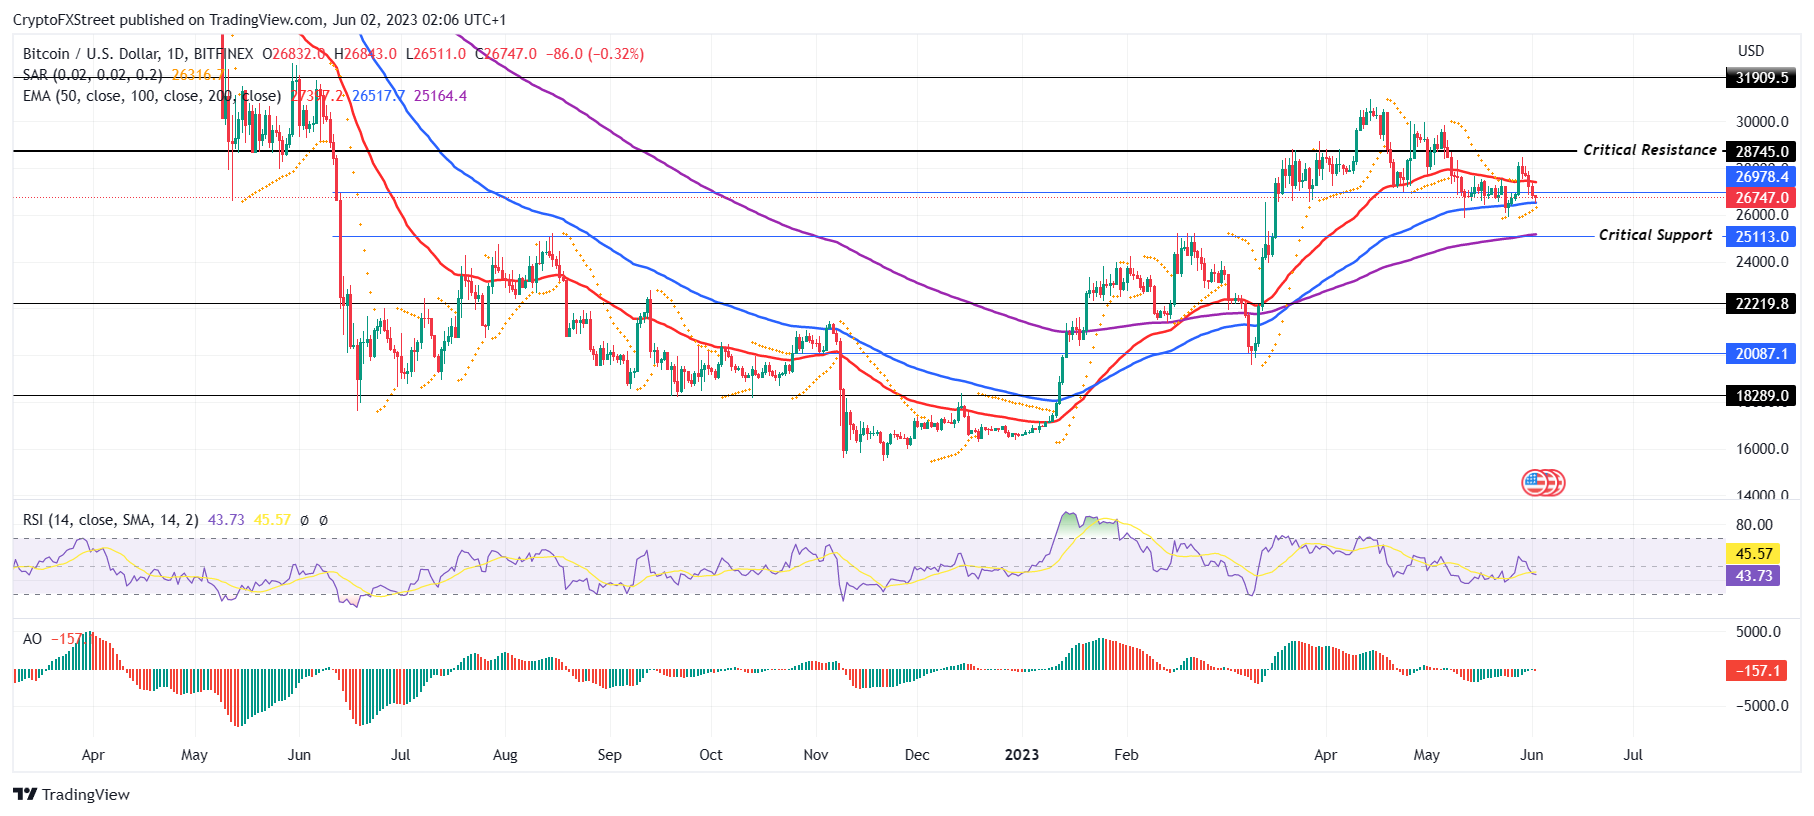
BTC/USD 1-day chart
But if the breach is rejected and the cryptocurrency declines and loses the support of the 100-day Exponential Moving Average (EMA), it could end up testing the critical support. Coinciding with the 200-day EMA, this level is marked at $25,113, and a drop below it would invalidate the bullish thesis.
Author

Aaryamann Shrivastava
FXStreet
Aaryamann Shrivastava is a Cryptocurrency journalist and market analyst with over 1,000 articles under his name. Graduated with an Honours in Journalism, he has been part of the crypto industry for more than a year now.


