Bitcoin price of $300,000 is a realistic target based on several on-chain metrics
- Bitcoin price could reach $318,000, according to a senior executive at US-based financial giant Citibank.
- Several on-chain metrics seem to support this bullish scenario in the long-term.

A new report from Citibank’s Managing Director, Tom Fitzpatrick, states that Bitcoin could reach $318,000 and that this cryptocurrency is the digital gold of the 21st century. Tom thinks BTC could touch that price by December 2021.
Although it is a high price target, some on-chain metrics could be suggesting something similar. The infamous Stock-to-Flow Bitcoin model would put Bitcoin price at least at $100,000 by the end of 2021.
What metrics support the idea of Bitcoin climbing above $100,000?
Citibank's report looks at the past price action of Bitcoin from 2011 until 2020. According to it, Bitcoin price seems to be quite symmetrical over the last seven years. The past rally from January 2015 to December 2017 had BTC price multiplied by 121 times.
The first significant rally from 2011 to 2013 was a 55,000% increase for Bitcoin price. Considering these ratios, it would seem that the next rally from 2018 until the top would put BTC at $318,000 by the end of 2021.
Other prominent analysts are also extremely optimistic about Bitcoin. Mike McGlone, a Bloomberg Intelligence analyst, sees Bitcoin at $100,000 by 2025. Although the outlook is less aggressive, it is still significantly bullish.
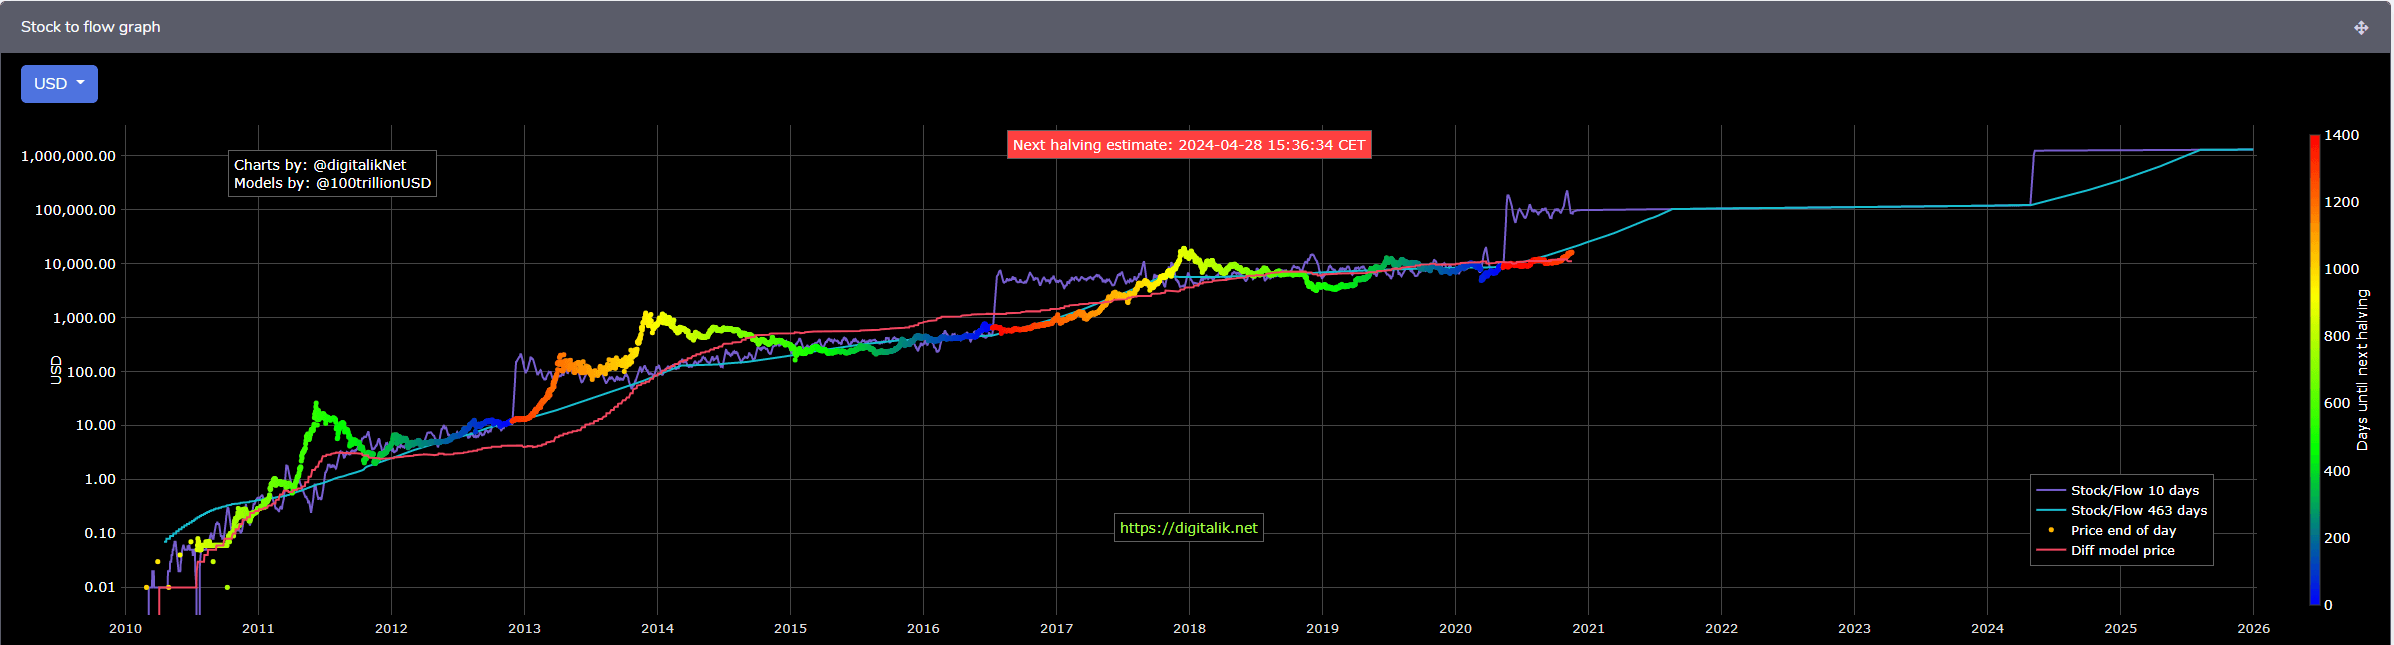
Bitcoin S2F chart
One of the most popular predictive models for Bitcoin is the Stock-to-Flow one, which calculates the average price of Bitcoin, keeping in mind past and upcoming halving events and the scarcity of BTC. The chart suggests BTC could reach $100,000 as early as September 2021.
Of course, this model doesn’t exclude the option of Bitcoin price spiking higher as it happened in December 2013 when BTC jumped to $1,000, while the model suggested the price should be around $100.
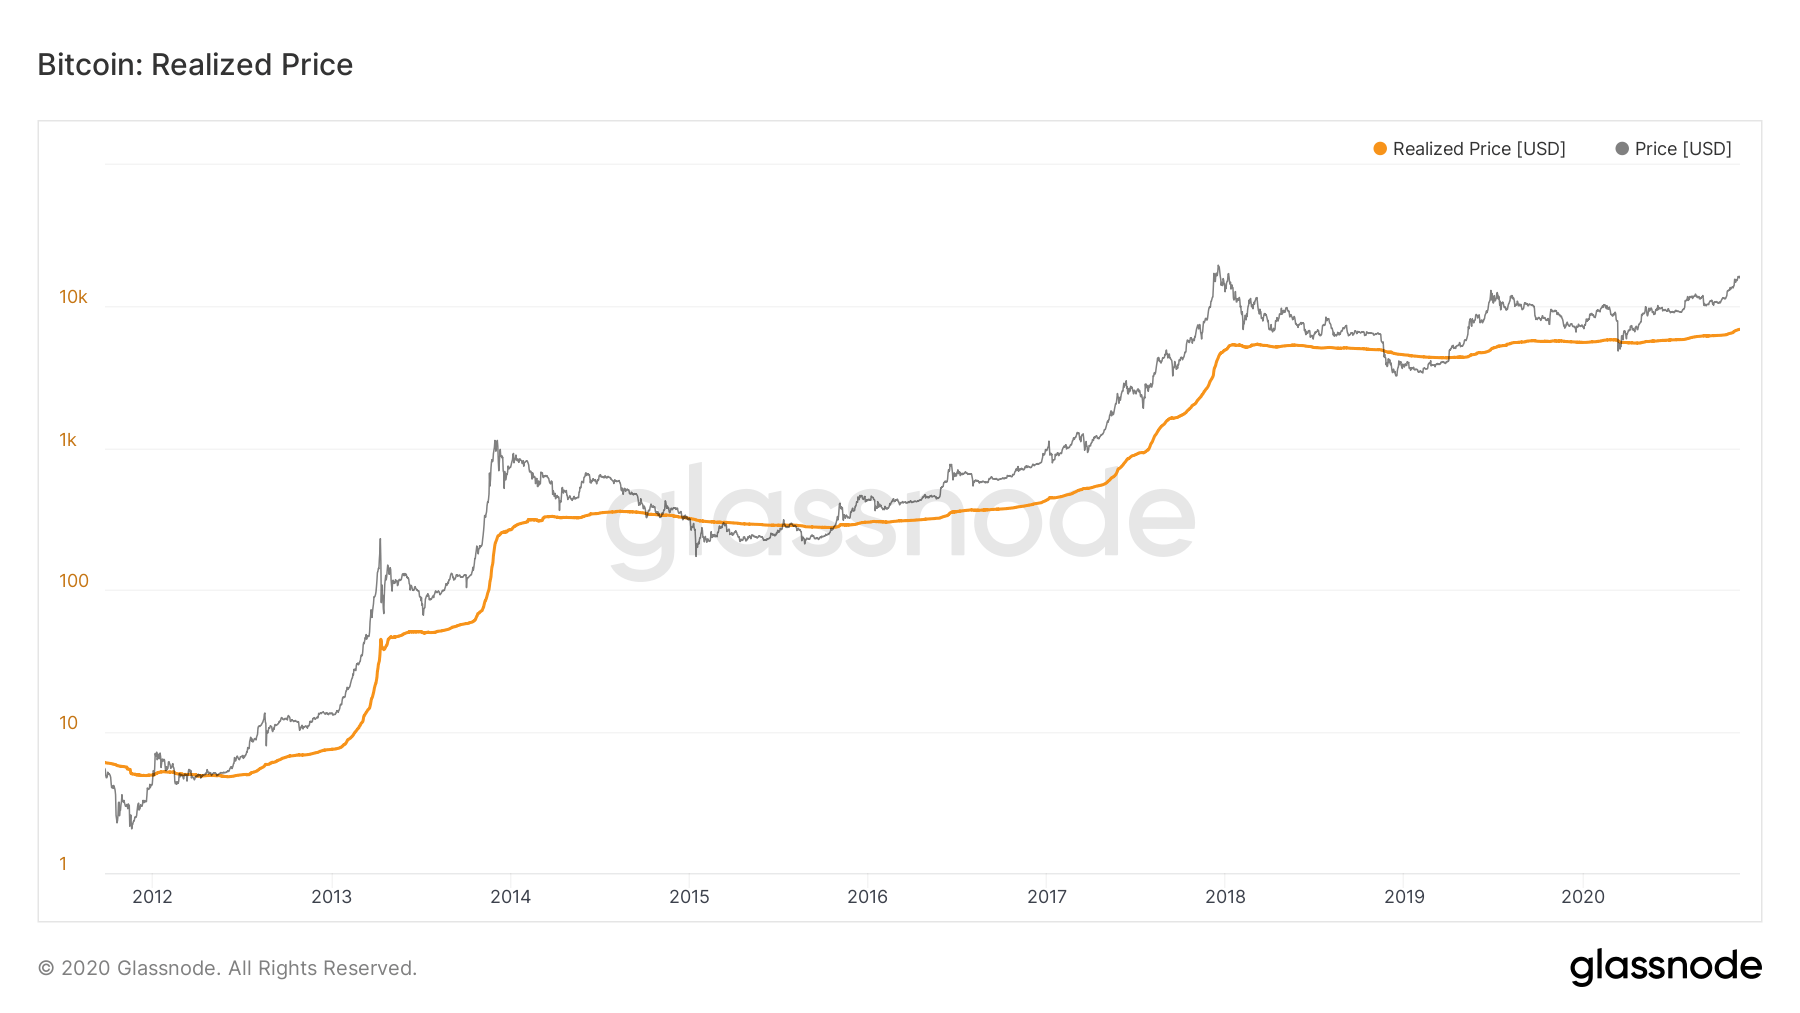
Bitcoin Realized Price chart
The Realized Price chart of Bitcoin shows an all-time high at $6,786. This metric calculates the average price investors paid for Bitcoin. The number is higher than it was in December 2017 at Bitcoin’s all-time high, indicating there is far more capital behind the recent rally, making it healthier and more sustainable in the long run.
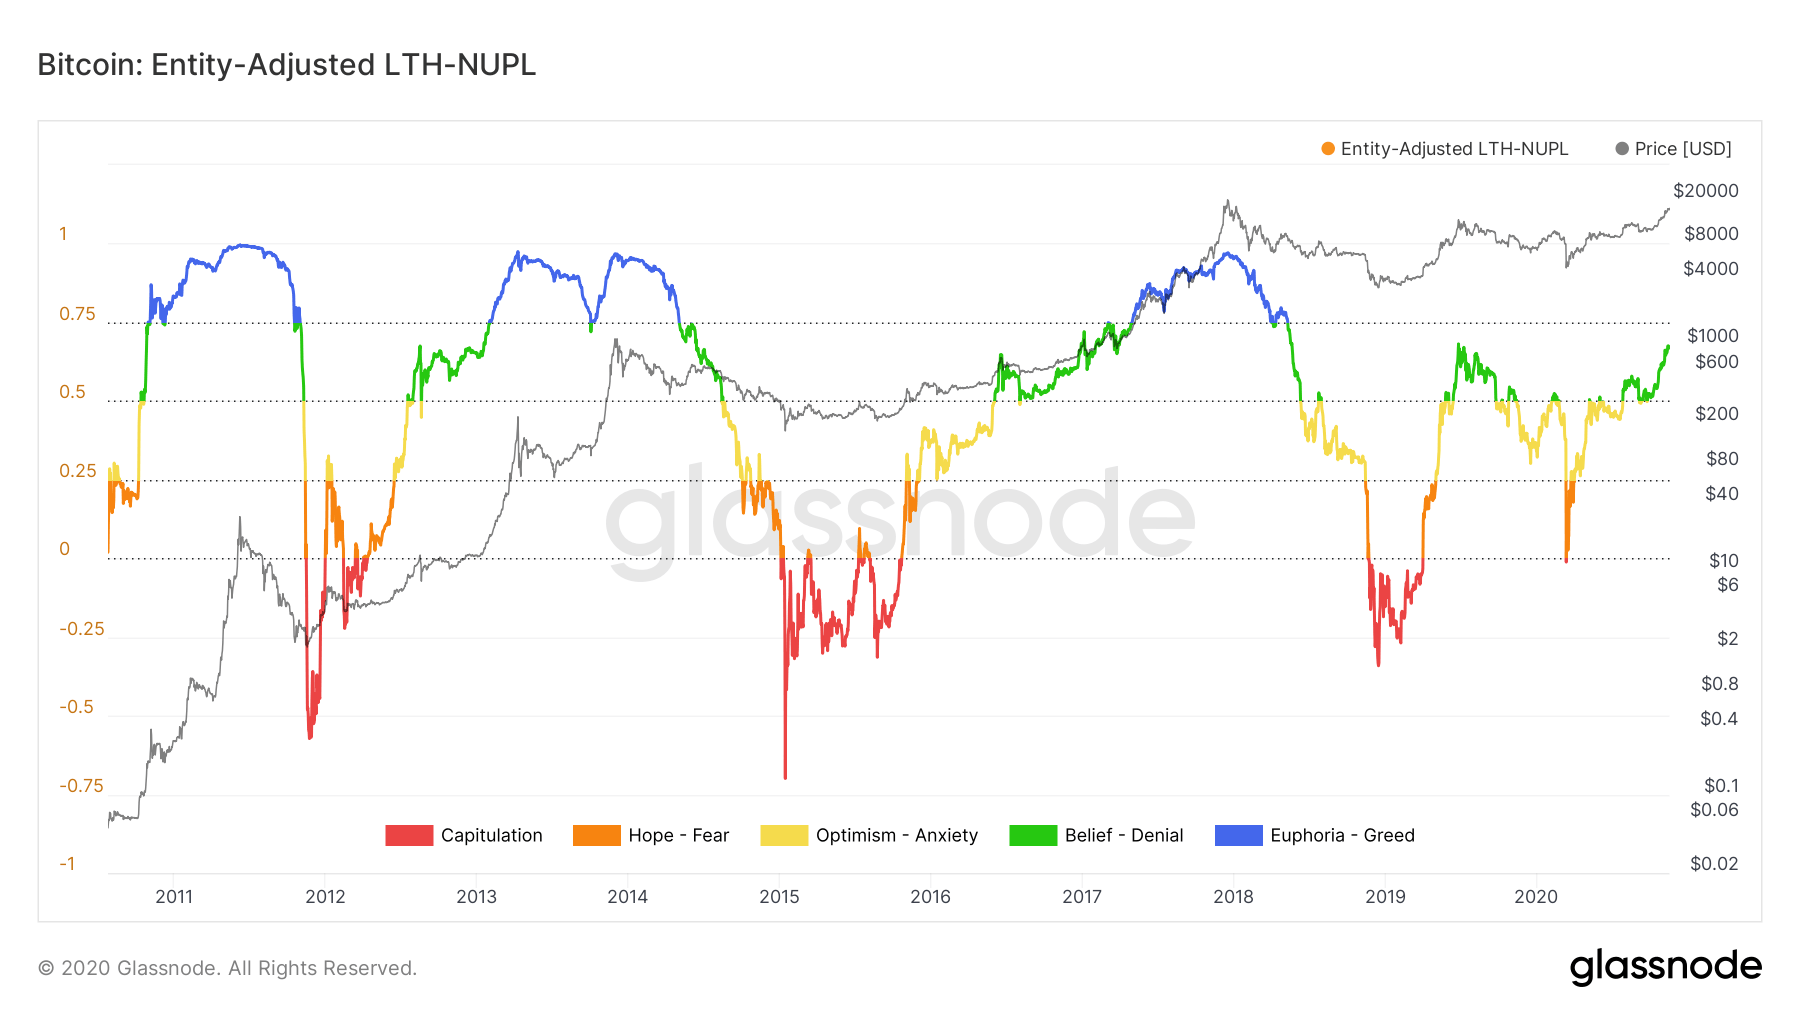
Bitcoin Entity-adjusted LTH-NUPL chart
The Entity-adjusted LTH-NUPL has also flipped bullish since July 2020. This metric basically shows the sentiment of market participants, ranging from capitulation to euphoria. It seems that the current state is belief, which indicates there is still more room for Bitcoin price to increase as market participants haven’t hit the euphoria phase yet.
Both Mike McGlone and Tom Fitzpatrick view Bitcoin as a potential alternative to gold. In fact, they suggest that Bitcoin could be a better version of the precious metal resembling its digital form. The current total value of gold is around $9 trillion, while Bitcoin sits at $300 billion, making the market capitalization of this last one too small for some important entities even to purchase it. These predictions might look far fetched at first, but many on-chain metrics are supporting them.
Author

Lorenzo Stroe
Independent Analyst
Lorenzo is an experienced Technical Analyst and Content Writer who has been working in the cryptocurrency industry since 2012. He also has a passion for trading.


