Bitcoin price has the potential to climb to $52,000
- Bitcoin price has a strong Fibonacci level between the $52,000 and $53,500 zone
- BTC price is consolidating above the parallel trend channel at $47,500
- A break below $44,500 will invalidate this thesis

Bitcoin price could continue higher as multiple Fibonacci projection tools are lining up with a $52,000 target zone. The current consolidation above a breached parallel channel also suggests bullish strength in the market.
Bitcoin price rally could still be underway
Bitcoin price has put on quite a show lately as investors saw prices soar to $48,200 at the start of the week. BTC price is currently consolidating at $47,500 and showing little to no evidence of a change in the trend. The Bitcoin price has a few bullish confluence signals to note. For one, a Fibonacci projection tool from the swing low at $37,500 to the swing high that breached the parallel trend at $45,000 suggests a 1 to 1 Fibonacci level could land Bitcoin price somewhere between $52,000 and $53,000.
This week, BTC price closed above a daily trend channel, printing a bullish engulfing candle at $46,900. A second Fibonacci level measuring the move projects a 2.618 Fibonacci level at $53,700. Scenarios like this are commonly referred to as Fibonacci Clusters, where significant Fib levels point to the same target zone despite different starting points.
It is also worth noting that the Bitcoin price is still hovering above the breached parallel channel at $47,500. This scenario warrants the idea of a potential continuation of the uptrend.
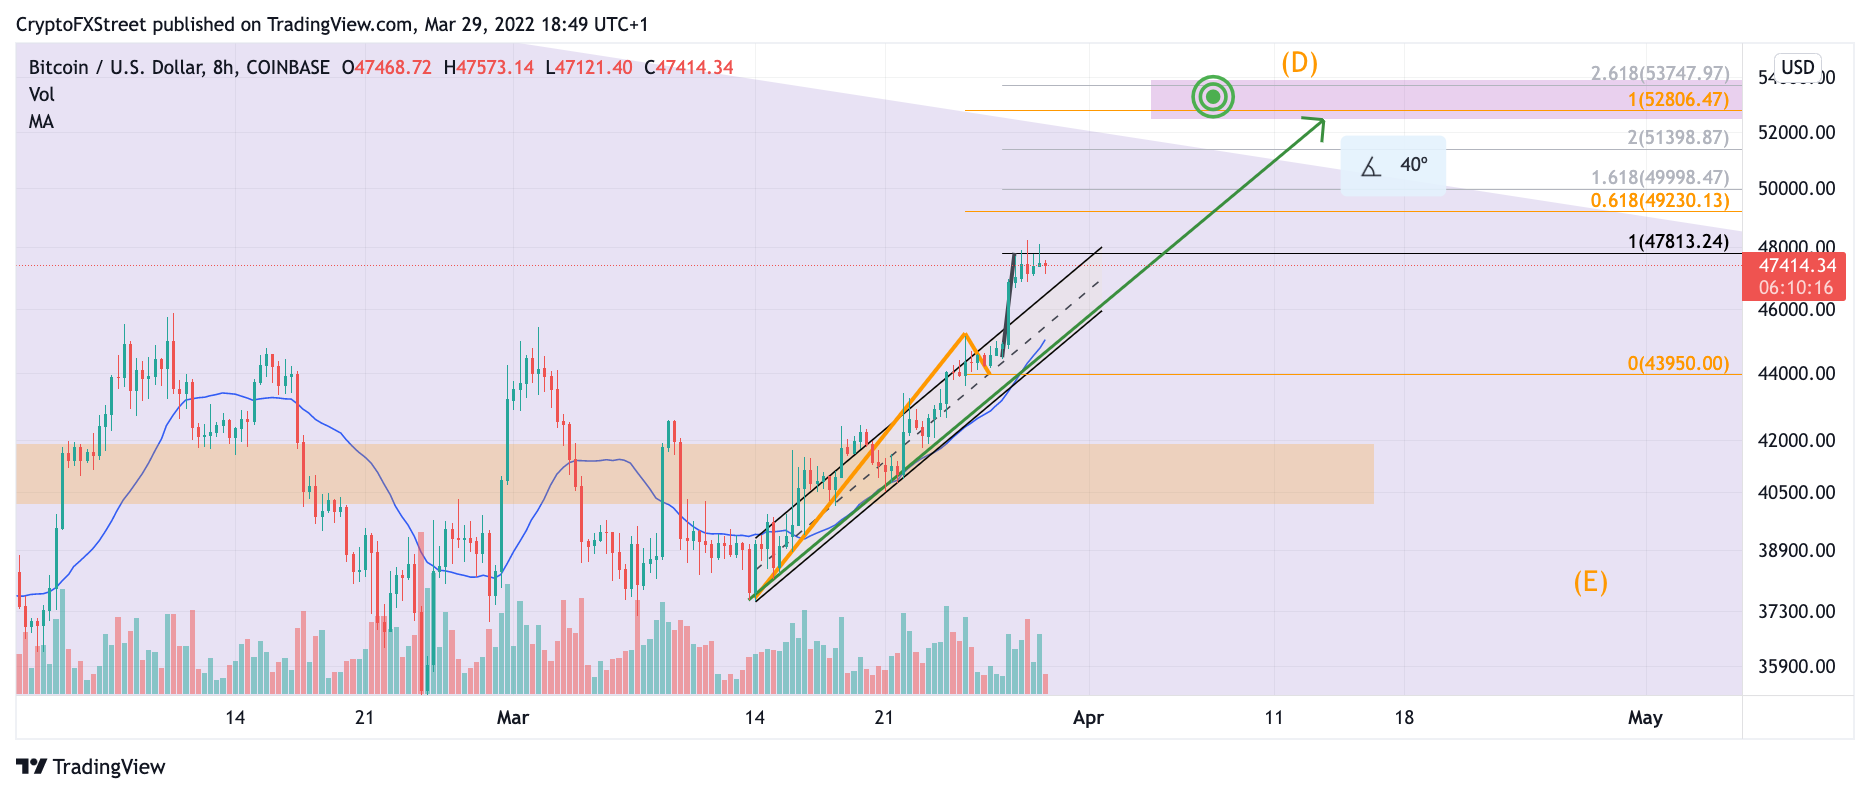
BTC/USD 8-Hour Chart
Still, the Bitcoin price could end up fooling the world yet again. Traders who missed out on last week’s trade setups should consider waiting for a bullish break above the current consolidation zone at $48,200. A close above $48,200 could send BTC price into the next target at $50,000 and $52,000, resulting in a 12% increase in price.
The invalidation level for this bullish thesis will dip into the 21 Exponential Moving Average on the 8-hour chart, which is currently resting at $44,000. Should this happen, prices will likely retest the parallel trend channel as resistance and subsequently send the BTC price back to the $41,800 zone, resulting in a 12% decrease in price.
Author

FXStreet Team
FXStreet
Composed of a group of economic journalists and FX experts, the FXStreet content team produces and oversees all content published on FXStreet. It provides a purely journalistic approach to the Forex market.



