Bitcoin Price Forecast: Here’s what needs to happen for BTC to hit $50,000
- Bitcoin price hovers above the 2024 open at $42,479 and the 2024 POC at $42,643.
- BTC has a higher chance of resuming the uptrend after tagging the daily FVG, extending from $41,396 to $40,288.
- A breakdown of the weekly level at $39,851 will invalidate the bullish thesis.

Bitcoin (BTC) price shot up 3% on Monday but has since undone most of the gains and currently trades around $42,762. But a few things need to happen before BTC shows its bullish hand and resumes the uptrend.
Also read: Week Ahead: Bitcoin price likely to support these altcoin narratives this week
Bitcoin price could reveal directional bias soon
Bitcoin price created the Monday’s range, extending from $41,807 to $43,324. The most common trade idea is to short BTC after a sweep of Monday’s high and book profits at Monday’s low.
Read more: Bitcoin Weekly Forecast: As monthly close draws near, significance of $43,750 grows
Here are a few key levels to watch if one is in this trade.
- The highest traded volume level of 2024, aka the Point of Control (POC) at $42,643.
- The 2024 yearly open at $42,479.
- The midpoint of the previous bear market at $42,235.
In addition to these levels, the daily imbalance, extending from $41,396 to $40,288, is also a key area to watch. Imbalances or gaps are formed when the asset moves rapidly up or down due to inefficient order flow. These gaps are often revisited by the asset to rebalance and serve as support or resistance, depending on the type of imbalance.
In BTC’s case, the imbalance was formed due to a spike in buying pressure, so a retracement into this area will be a good place for sidelined buyers to open a long position.
While this short-term play shows promise of a quick upside, investors need to be mindful of the big picture as well. As mentioned in a previous publication, Bitcoin price needs to produce a daily candlestick close above $48,222 to sustain the uptrend outlook.
Supporting the bullish outlook are the Relative Strength Index (RSI) and the Awesome Oscillator (AO) momentum indicators. The RSI has overcome the 50 mean level and is retesting it as a support, which is a bullish indication. The AO is close to flipping above the zero level, which shows a shift in momentum favoring bulls.
In such a case, Bitcoin price could easily overcome the $48,222 level and potentially retest the $50,000 psychological level.
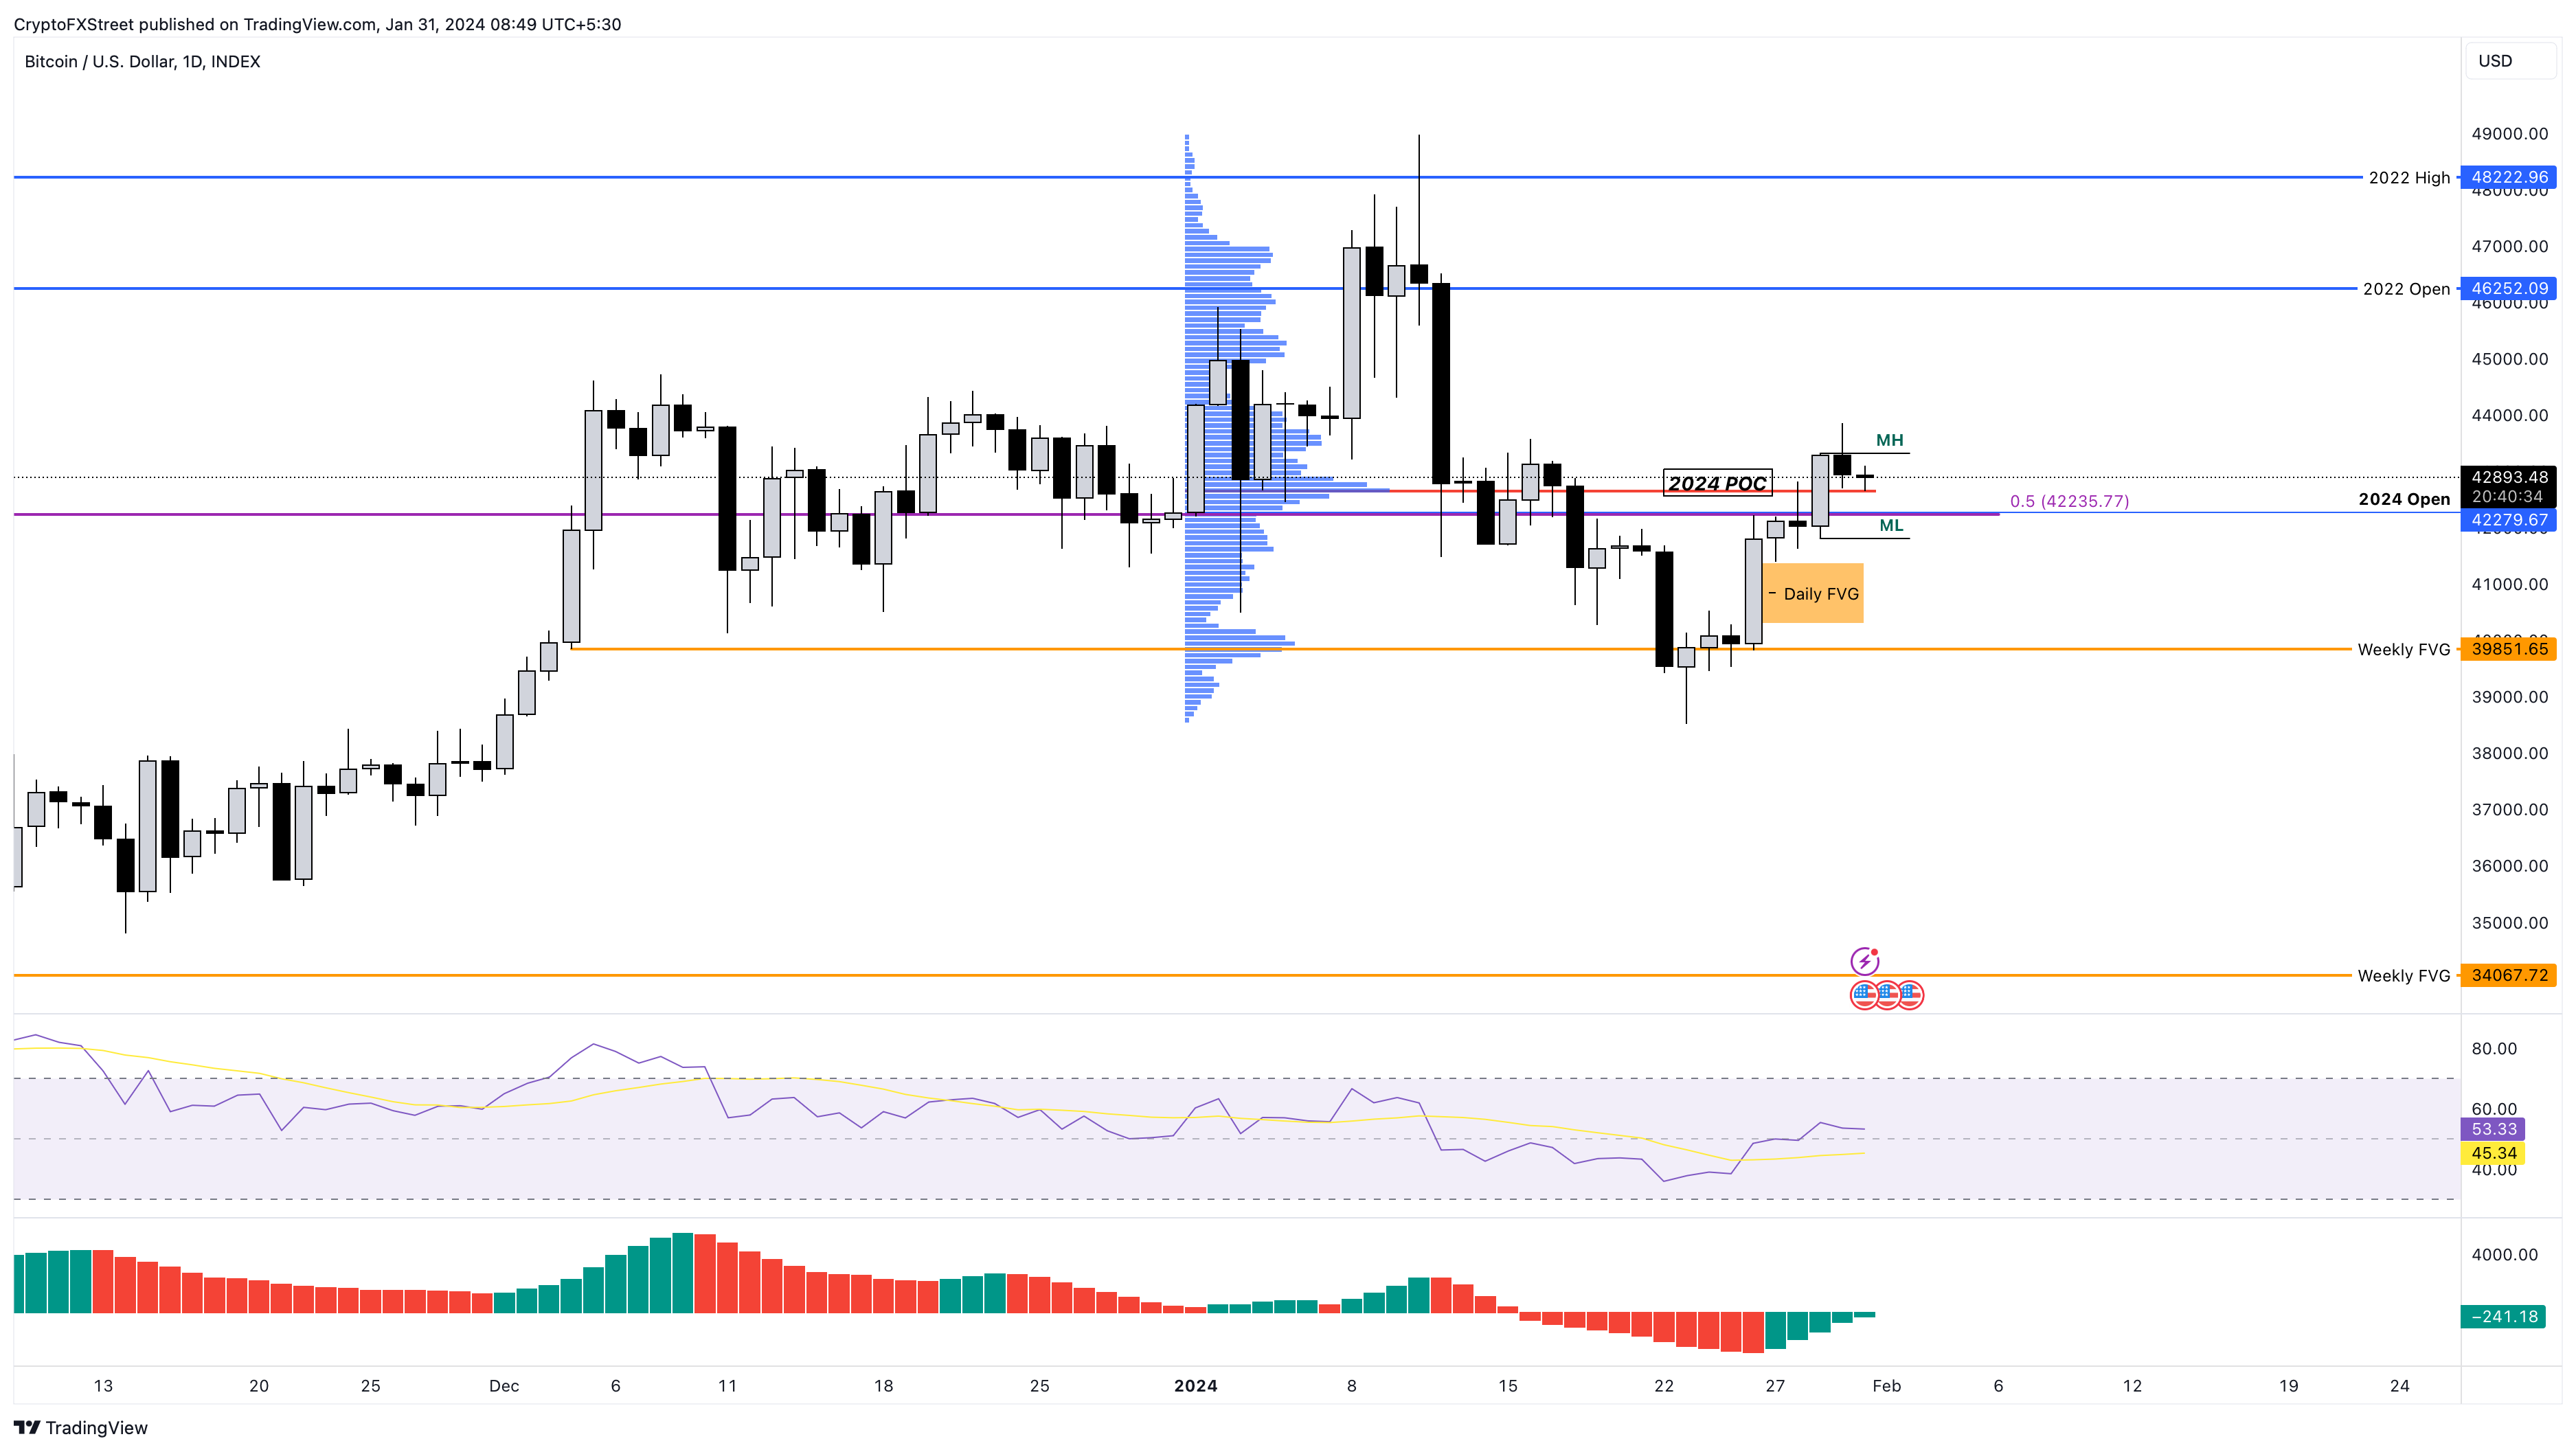
BTC/USDT 1-day chart
However, a potential spike in selling pressure that pushes Bitcoin price to slice through the $41,396 to $40,288 imbalance would denote a weak bullish camp. If this trend continues and leads to the production of a daily candlestick close below $39,851, it would produce a lower low and invalidate the bullish thesis for BTC.
In such a case, a steeper correction could be anticipated by investors, as pointed out in a previous publication. The $34,067 and $32,293 support levels will be where the Bitcoin price would likely consolidate and rethink a bounce.
Read more: Bitcoin Weekly Forecast: Will BTC correct to $35k or continue bull run without steep corrections?
Author

Akash Girimath
FXStreet
Akash Girimath is a Mechanical Engineer interested in the chaos of the financial markets. Trying to make sense of this convoluted yet fascinating space, he switched his engineering job to become a crypto reporter and analyst.


