Bitcoin price flaunts possible falling bullish wedge revival amid fears of decoupling from traditional markets
- Bitcoin price is moving closer to validating a potential falling wedge pattern in the wake of a drop to $19,543.
- The biggest cryptocurrency risks decoupling from traditional markets due to low forward guidance from the US Federal Reserve.
- The IOMAP model cites increasing resistance of around $21,000, which may delay or sabotage further recovery.

Bitcoin price is up by 1.6% over the last 24 hours against a backdrop of 7.0% in cumulative losses across seven days. The pioneer cryptocurrency is trying to arrest last week's downtrend, which saw its leg tag $19,543 on the downside. Possibly, a daily close above $20,000 will push BTC higher and authenticate a falling wedge pattern breakout with eyes set on $23,000.
Why Bitcoin price may face increased resistance in the months ahead
The flagship cryptocurrency may be forced to deal with increased volatility in upcoming months as it decouples from traditional markets. The lack of or lowered forward guidance from the United States Federal Reserve implies that investors will have to rely on market data – much like the regulatory body – as far as interest rate hikes are concerned.
During the annual Jackson Hole Symposium last week, the Fed's Chair, Jerome Powell, reckoned that the next hike would depend on economic data. His insight came before September's expected FOMC (Federal Open Market Committee) meeting on monetary policy.
"Volatility is unlikely to go away in the coming months as the Fed is preparing to step up the process of shrinking its massive $9 trillion balance sheet or the so-called quantitative tightening in September," a newsletter sent by Kaiko researchers on Monday read.
High volatility may take center stage for Bitcoin price in the months ahead as rising interest rates put pressure on risky assets like BTC.
Read more: Wall Street believes Bitcoin price hit its bottom after key move by US Federal Reserve
Bitcoin price is on the cusp of triggering a breakout
A wedge pattern on the daily chart is parading a potential bullish breakout. However, the move largely depends on the Bitcoin price's ability to crack through the upper trend line, as illustrated in the chart.
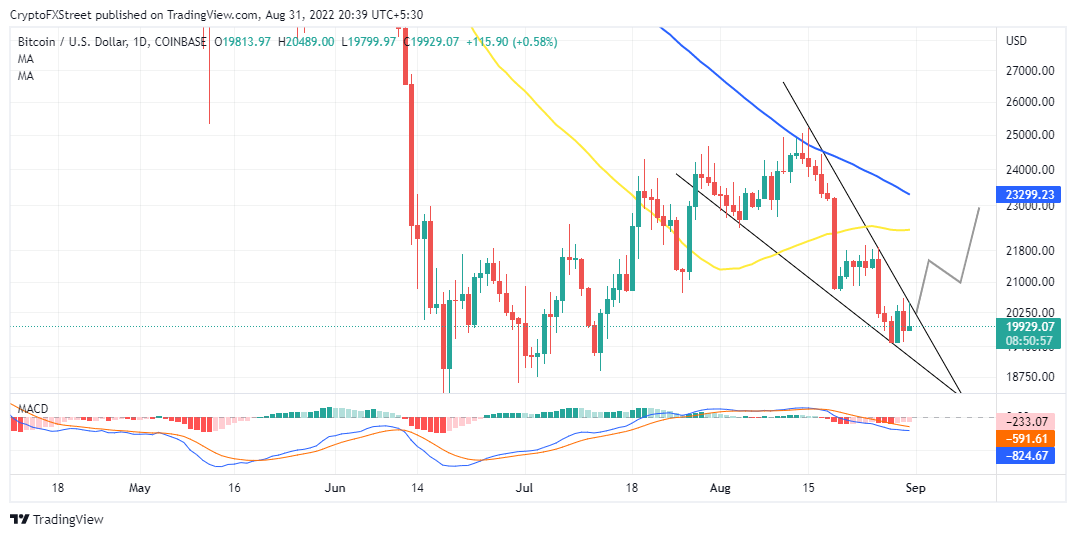
BTC/USD daily chart
Traders must show restraint ascribing to the Moving Average Convergence Divergence (MACD) indicator position below the mean line. The 12-day Exponential Moving Average (EMA) is required to cross above the 26-day EMA – to reinforce the climb to $23,000.
-637975590630061680.png)
Bitcoin IOMAP chart
It is worth mentioning that Bitcoin price sits on top of solid support between $19,482 and $20,089. ITB (IntoTheBlock) shows approximately 798,500 addresses previously purchased, roughly 457,900 BTC in the range. Holders within this region are likely to fight potential declines, leaving Bitcoin price's path of the least resistance on the upside.
On the other hand, a recovery above $21,000 may stall between $20,763 and $21,370. The roughly 800,000 addresses that bought around 386 BTC in the range may choose to liquidate, thus dampening the uptrend. A break above this zone might be a zero-sum game, citing resistance at $21,590 and $22,978.
Read more: Bitcoin Price Prediction: September's Vengeful Decline
Author

John Isige
FXStreet
John Isige is a seasoned cryptocurrency journalist and markets analyst committed to delivering high-quality, actionable insights tailored to traders, investors, and crypto enthusiasts. He enjoys deep dives into emerging Web3 tren


