Bitcoin extends losses, risking further declines if it closes below $56,000
- Bitcoin price approaches a crucial support level at $56,000; a close below it could see its downtrend persist.
- US spot Bitcoin ETFs registered an outflow of $287.80 million on Tuesday.
- On-chain data paints a bearish picture as Bitcoin’s long-to-short is below one.
- Bitcoin’s correlation with the US stock market persists, albeit less pronounced than before.

Bitcoin (BTC) extends its decline by 1.5% on Wednesday, following the rejection from the key resistance level on Tuesday and hurt by a drop in the US stock market. This downtrend may persist if BTC falls below the $56,000 support level, especially as US spot Bitcoin ETFs saw an outflow of almost $290 million. On-chain data also shows a bearish outlook, with the long-to-short ratio falling below one.
Daily digest market movers: Bitcoin price declines as US stock market sinks
- Sentiment data highlights the evolving correlation between the US stock market and Bitcoin prices. Bitcoin’s recent dip is relatively minor compared to the US stock market’s sharp decline.
Historically, Bitcoin fell over 7% when the S&P 500 dropped 3% on August 5. Still, with the S&P 500 declining 2.16% on Tuesday, Bitcoin’s correction was limited to 2.78%, suggesting a potential reduction in Bitcoin’s sensitivity to stock market fluctuations.
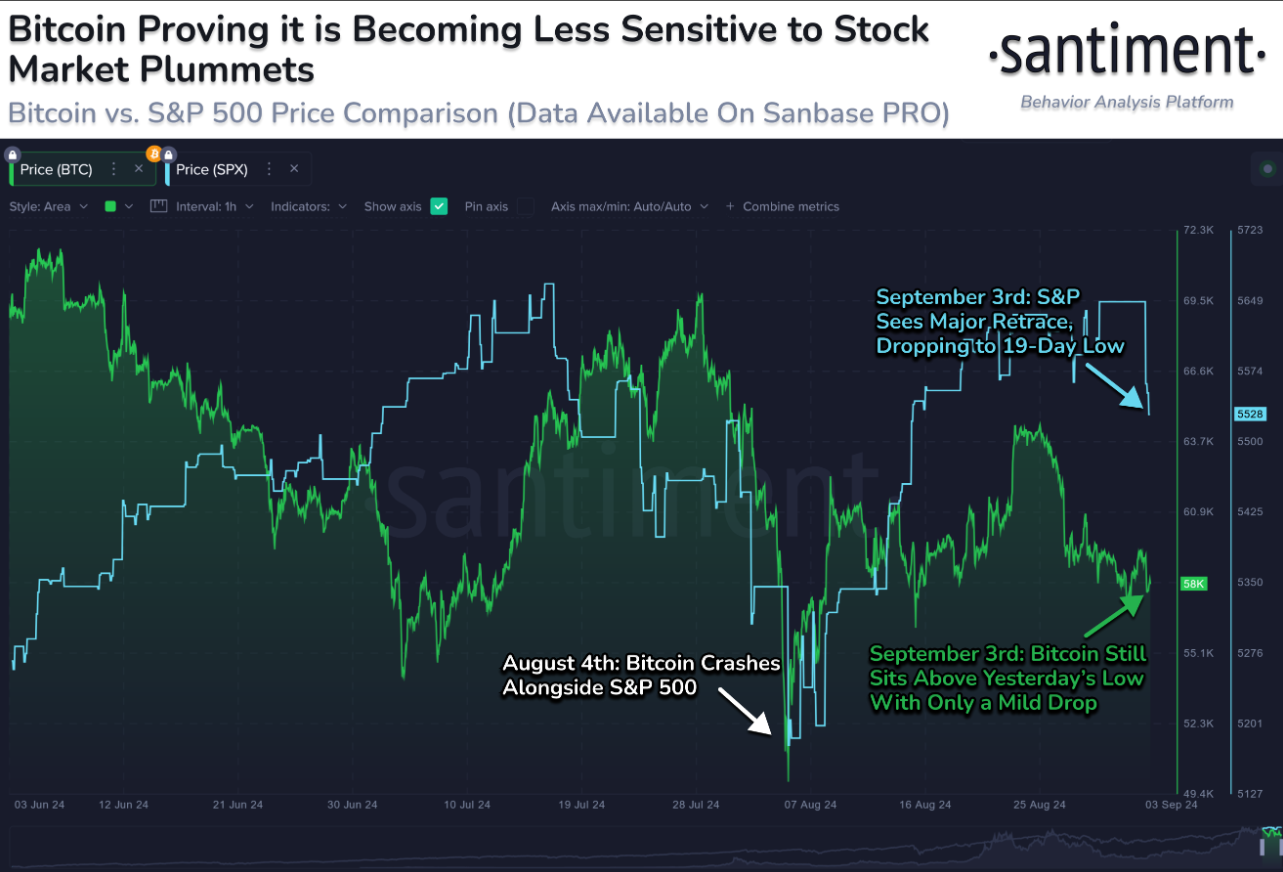
Bitcoin and S&P 500 comparison chart
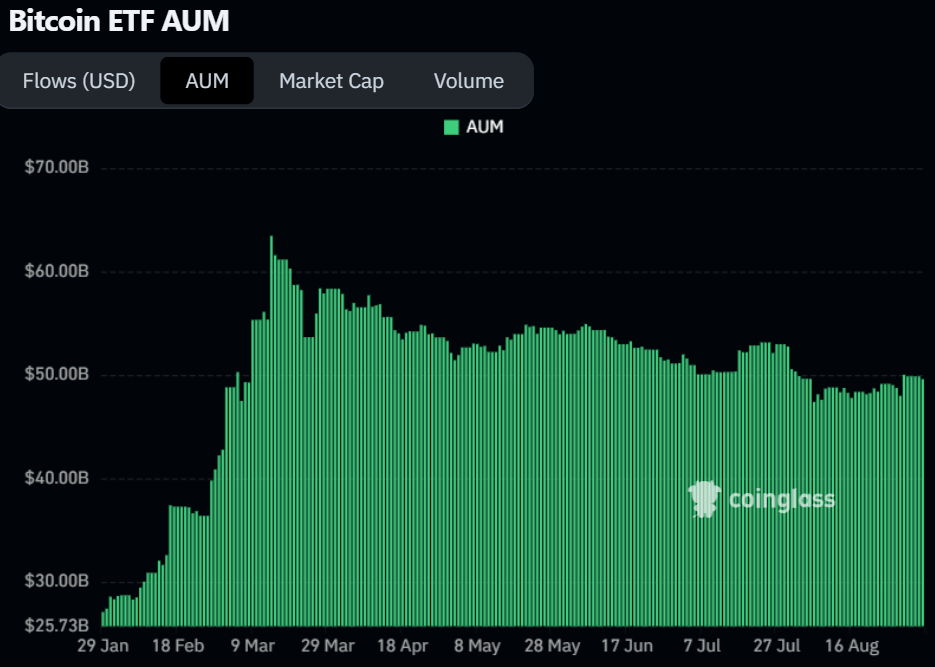
- According to Coinglass data, US spot Bitcoin ETFs recorded an outflow of $287.80 million on Tuesday, a sign of waning demand. The combined Bitcoin reserves held by the 11 US spot Bitcoin ETFs stand at $43.14 billion, a number that has been constantly declining since late August.
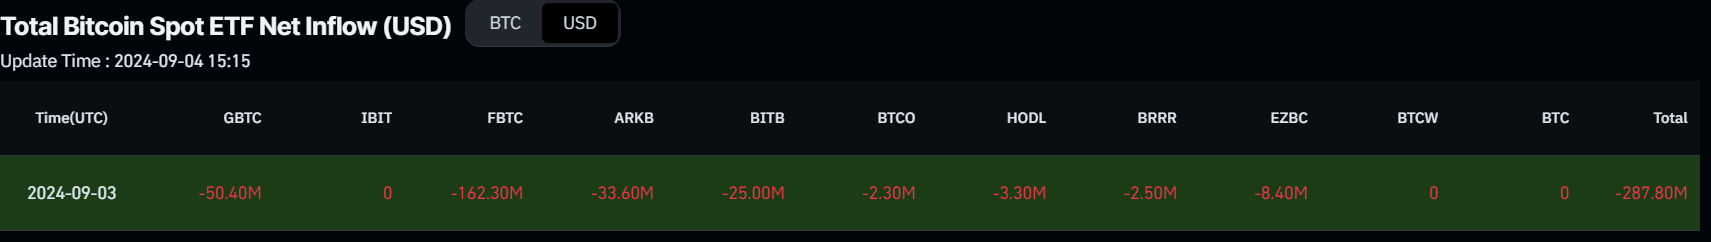
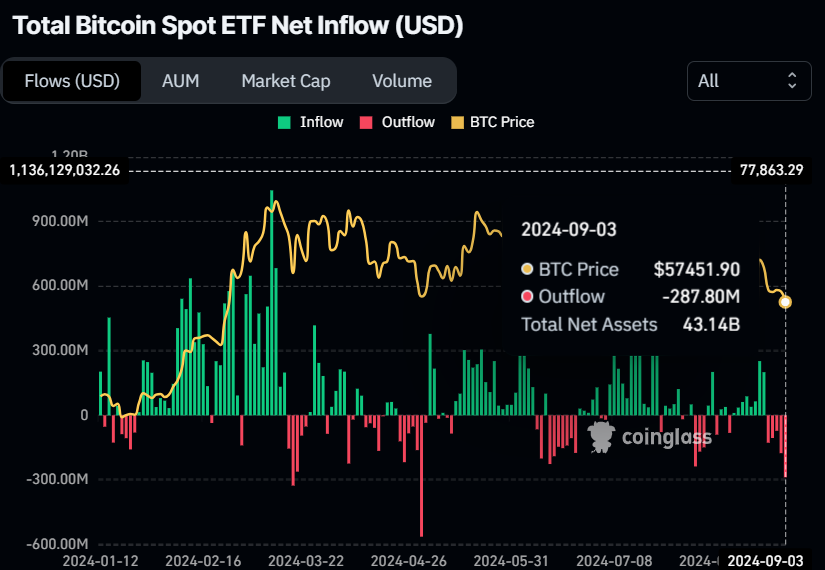
Bitcoin Spot ETF Net Inflow chart
Bitcoin ETF AUM chart
- Coinglass’s Bitcoin long-to-short ratio also stands at 0.95, supporting the bearish outlook. This ratio reflects bearish sentiment in the market as a number below one suggests that more traders anticipate the asset’s price to fall.
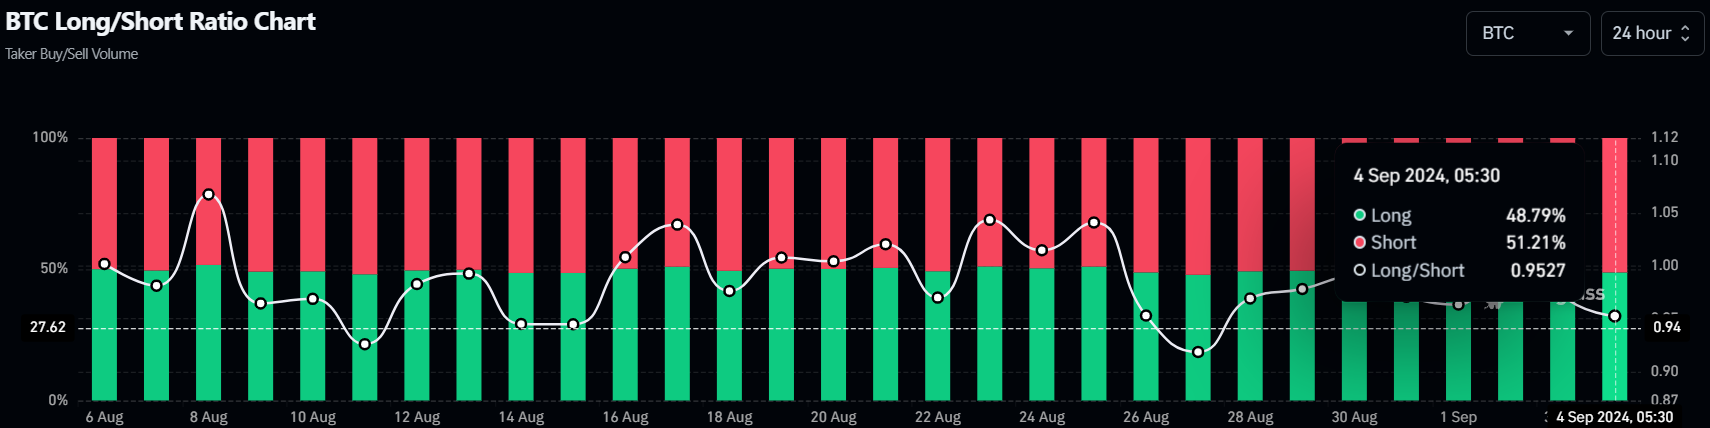
Bitcoin long-to-short ratio chart
BTC Technical analysis: All eyes on $56,000
Bitcoin was rejected after retesting its 50% price retracement level at $59,560 (drawn from a high in late July to a low in early August) and dropped 2.78% on Tuesday. On Wednesday, it continued its downtrend, declining by 1.5% to $56,622 and retesting the daily support level at $56,022.
If BTC closes below this $56,022, it could decline further by 3.5% to retest the $54,000 psychological level.
The Relative Strength Index (RSI) and the Awesome Oscillator (AO) on the daily chart trade below their respective neutral levels of 50 and zero, respectively. Both indicators suggest weak momentum and a continuation of its downward trend.
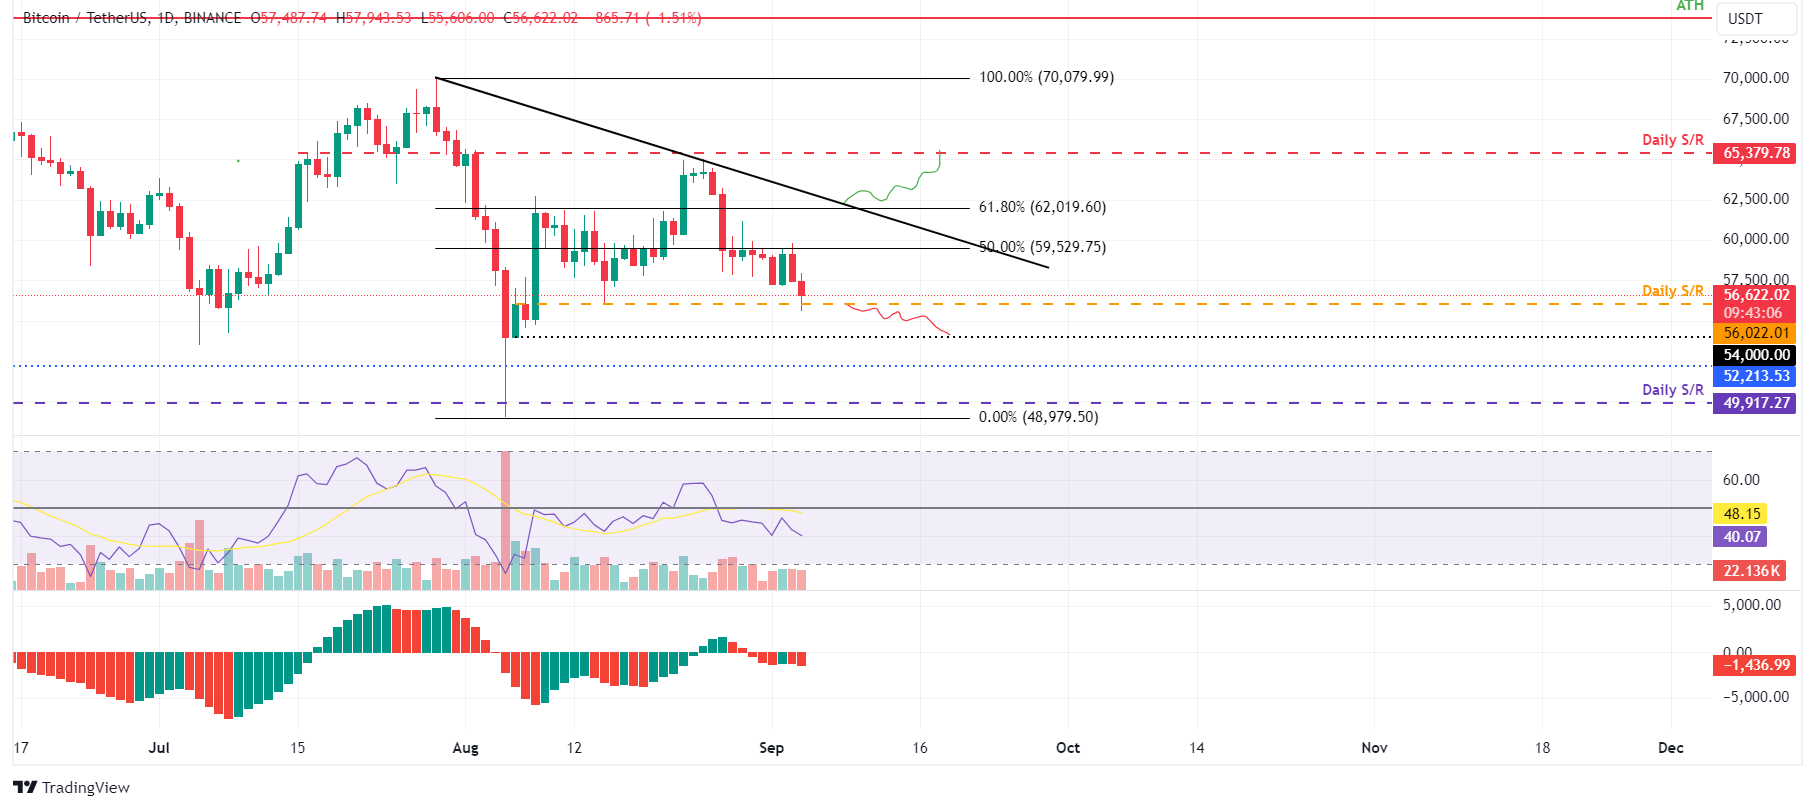
BTC/USDT daily chart
However, if Bitcoin’s price breaks above the $59,560 resistance and closes above $62,019, the 61.8% Fibonacci retracement level, the bearish thesis will be invalidated. In this scenario, BTC could extend the positive move by 5.5% to revisit its daily resistance level at $65,379.
Bitcoin, altcoins, stablecoins FAQs
Bitcoin is the largest cryptocurrency by market capitalization, a virtual currency designed to serve as money. This form of payment cannot be controlled by any one person, group, or entity, which eliminates the need for third-party participation during financial transactions.
Altcoins are any cryptocurrency apart from Bitcoin, but some also regard Ethereum as a non-altcoin because it is from these two cryptocurrencies that forking happens. If this is true, then Litecoin is the first altcoin, forked from the Bitcoin protocol and, therefore, an “improved” version of it.
Stablecoins are cryptocurrencies designed to have a stable price, with their value backed by a reserve of the asset it represents. To achieve this, the value of any one stablecoin is pegged to a commodity or financial instrument, such as the US Dollar (USD), with its supply regulated by an algorithm or demand. The main goal of stablecoins is to provide an on/off-ramp for investors willing to trade and invest in cryptocurrencies. Stablecoins also allow investors to store value since cryptocurrencies, in general, are subject to volatility.
Bitcoin dominance is the ratio of Bitcoin's market capitalization to the total market capitalization of all cryptocurrencies combined. It provides a clear picture of Bitcoin’s interest among investors. A high BTC dominance typically happens before and during a bull run, in which investors resort to investing in relatively stable and high market capitalization cryptocurrency like Bitcoin. A drop in BTC dominance usually means that investors are moving their capital and/or profits to altcoins in a quest for higher returns, which usually triggers an explosion of altcoin rallies.
Author

Manish Chhetri
FXStreet
Manish Chhetri is a crypto specialist with over four years of experience in the cryptocurrency industry.


