|

Bitcoin Price Analysis: Primed for a breakout towards $10K amid a descending channel pattern

  • Bitcoin range play intact within a descending channel on hourly chart.
  • The No.1 coin aiming for a test of the $10000 level.
  • BTC bulls await fresh impetus, with RSI flat at the midline.

Bitcoin (BTC/USD), the most favorite crypto asset, attempts another break to the upside after a brief consolidative stint between 9300-9500 levels on Saturday. However, the bulls continue to lack a follow-through bias amid fairly quiet trading. The no. 1 coin appears to gather pace before the next push higher towards 10K mark. The halving process failed to have any impact on the spot, as the impact was already priced-in. Despite the range trade, the price gains nearly 1.50% on the day, trading around 9425, at the time of writing. Bitcoin is poised to settle the week almost -2.30% while enjoying a market capitalization of $173.89 billion.

Technical Overview

BTC/USD 1-hour chart

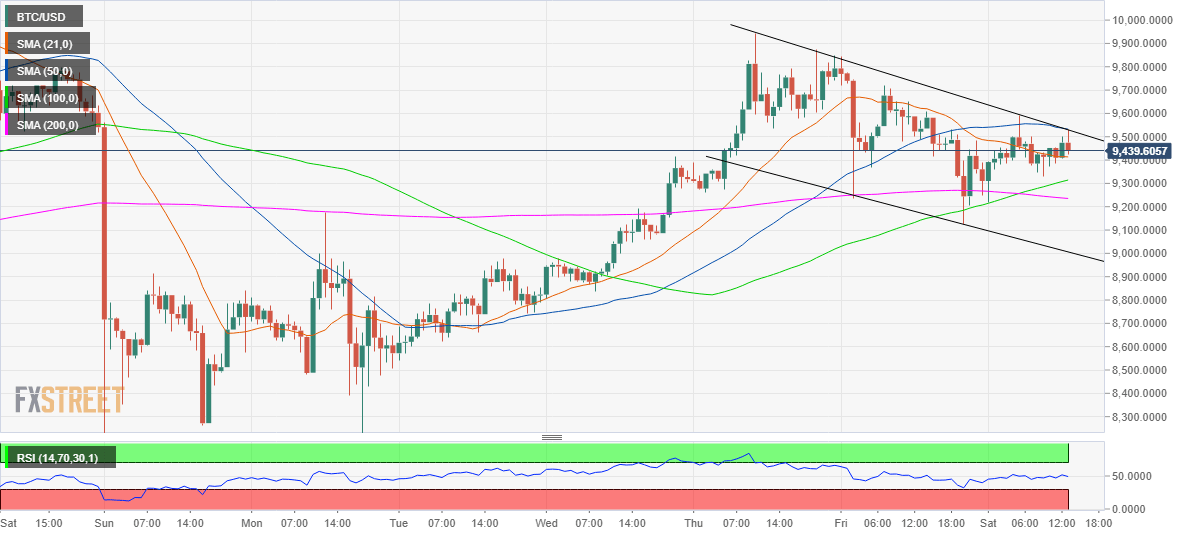
From a short-term technical perspective, the most widely traded digital asset is primed for a bullish break from the descending channel formation on the hourly chart. The pattern will get validated on clearance of the descending trendline resistance at 9530. The bearish 50-Hourly Simple Moving Average (HMA) coincides at that level.

The channel break out will prompt the buyers to aim for the 10000 psychological level, beyond which the pattern target of 10351 will come into play. Further, backing the bullish case for the spot, the hourly Relative Strength Index (RSI) is trending above the midline (50) at 51.30.

On the flip side, the immediate support is aligned at a horizontal 21-HMA of 9414. Selling interest will intensify on a break below the latter, with the upward sloping 100-HMA at 9314 en route the 200-HMA support, now at 9235.   

BTC/USD technical levels to watch

BTC/USD

Overview
Today last price9426.30
Today Daily Change128.83
Today Daily Change %1.38
Today daily open9310.4
 
Trends
Daily SMA208917.97
Daily SMA507714.25
Daily SMA1008002.23
Daily SMA2008049.14
 
Levels
Previous Daily High9843.97
Previous Daily Low9123.36
Previous Weekly High9944.79
Previous Weekly Low8105.58
Previous Monthly High9476.83
Previous Monthly Low6156.67
Daily Fibonacci 38.2%9398.63
Daily Fibonacci 61.8%9568.7
Daily Pivot Point S19007.85
Daily Pivot Point S28705.31
Daily Pivot Point S38287.25
Daily Pivot Point R19728.46
Daily Pivot Point R210146.51
Daily Pivot Point R310449.06

Author

Dhwani Mehta

Dhwani Mehta

FXStreet

Residing in Mumbai (India), Dhwani is a Senior Analyst and Manager of the Asian session at FXStreet. She has over 10 years of experience in analyzing and covering the global financial markets, with specialization in Forex and commodities markets.

More from Dhwani Mehta
Share:

Editor's Picks

Crypto Today: Bitcoin, Ethereum, XRP recovery slows amid incessant capital outflows

The cryptocurrency remains in a broader corrective bias on Friday, despite majors such as Bitcoin (BTC), Ethereum (ETH), and Ripple (XRP) holding slightly higher than early-week support levels.

Cardano: Whale selling, cautious derivatives limit ADA rebound

Cardano is trading near $0.170 at the time of writing on Friday after staging a modest rebound from last week's sharp correction. However, the recovery remains fragile as large holders have resumed reducing their positions, adding fresh selling pressure to ADA.

Experts agree: Bitcoin nears bottom, but weak demand raises doubts

Bitcoin (BTC) is trading above $63,000 at the time of writing on Friday after rebounding from the key 200-week Simple Moving Average (SMA) near $62,000, a level widely viewed as key long-term support.

Pi Network Price Forecast: Bulls attempt comeback as bearish strength fades

Pi Network is trading at around $0.120 on Friday after a modest recovery the previous day. Despite this recent rebound, traders should be cautious as a scheduled unlock of 14.8 million PI tokens on Friday could limit the token's recovery potential by increasing market supply.

Experts agree: Bitcoin nears bottom, but weak demand raises doubts
Bitcoin (BTC) is trading above $63,000 at the time of writing on Friday after rebounding from the key 200-week Simple Moving Average (SMA) near $62,000, a level widely viewed as key long-term support. The recovery may suggest that Bitcoin has found a floor after a sharp correction that spanned more than a month, but some warning signs persist.