|

Bitcoin Price Analysis: BTC/USD snaps three-day downtrend as traders flirt with $36,000

  • BTC/USD picks up bids from $35,576, manages to stay above 21-day SMA.
  • Bearish MACD, one-week-old faling trend line challenge buyers.
  • Monthly low, key Fibonacci retracement levels add to downside filters.

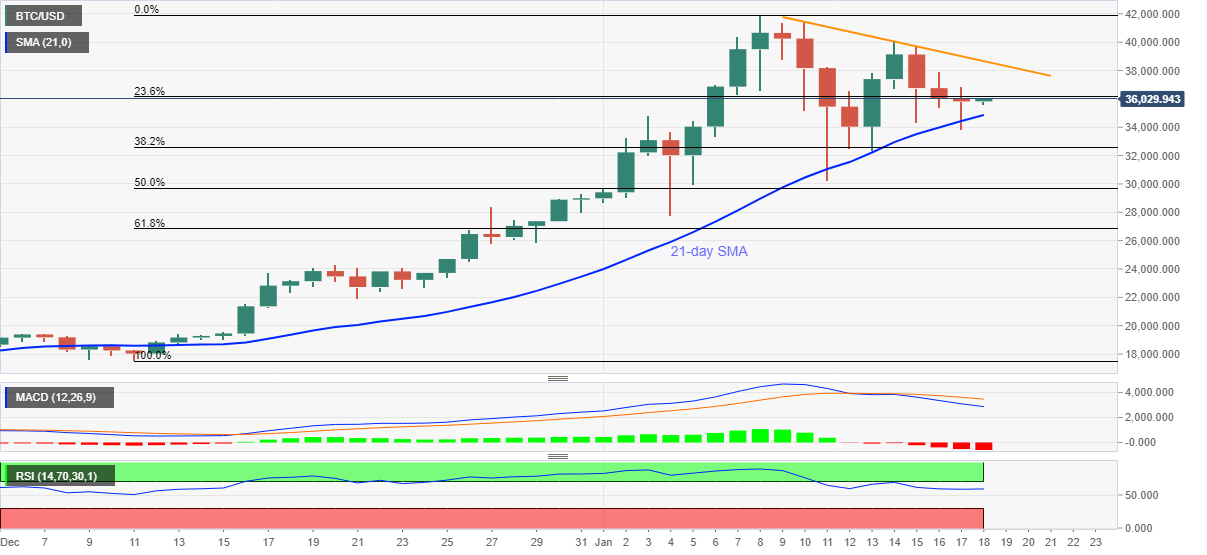
BTC/USD bounces off intraday low of $35,576 to tease the $36,000 threshold, currently around $35,860, during early Monday. The crypto major dropped to the lowest since January 13 the previous day but failed to provide a daily closing below 21-day SMA.

As a result, the following corrective pullback probes BTC/USD sellers for the first time in four days even as bearish MACD and short-term resistance line test the quote’s upside momentum.

That said, $37,980 and the $38,000 round-figure can offer immediate resistance to BTC/USD ahead of highlighting a downward sloping trend line from January 10, 2021, at $38,665 now.

In a case where the BTC/USD bulls manage to cross the $38,665 level, the $40,000 psychological magnet and the recently marked record top near $42,000 should return to the charts.

Meanwhile, a downside break of 21-day SMA, currently around $34,590, can direct short-term sellers toward the monthly low of $30,209 and then to the $30,000 threshold.

However, any further downside below $30,000 will make BTC/USD vulnerable enough to revisit the 50% and 61.8% Fibonacci retracement level of December-January upside, respectively around $29,700 and $26.830.

BTC/USD daily chart
Trend: Pullback expected

Additional important levels

Overview
Today last price35835.32
Today Daily Change13.20
Today Daily Change %0.04%
Today daily open35822.12
 
Trends
Daily SMA2034805.01
Daily SMA5026606.71
Daily SMA10020649.55
Daily SMA20015651.05
 
Levels
Previous Daily High36854.53
Previous Daily Low33853.12
Previous Weekly High41444.8
Previous Weekly Low30209.97
Previous Monthly High29307.4
Previous Monthly Low17578.63
Daily Fibonacci 38.2%34999.66
Daily Fibonacci 61.8%35707.99
Daily Pivot Point S134165.31
Daily Pivot Point S232508.51
Daily Pivot Point S331163.9
Daily Pivot Point R137166.73
Daily Pivot Point R238511.34
Daily Pivot Point R340168.14

Author

Anil Panchal

Anil Panchal

FXStreet

Anil Panchal has nearly 15 years of experience in tracking financial markets. With a keen interest in macroeconomics, Anil aptly tracks global news/updates and stays well-informed about the global financial moves and their implications.


More from Anil Panchal
Share:

Editor's Picks

Ripple eyes $1.50 breakout despite softening on-chain activity

XRP remains elevated near $1.45 after a sharp spike from the weekly low of $1.31. XRP retains a neutral-to-bullish technical outlook, supported by the RSI and uptrending moving averages.

Zcash Price Forecast: Rally hits nine-year high above $1,000 amid growing shielded demand

Zcash trades above $1,000 on Friday, building on its 16% gain from the previous day. On-chain data show a steady increase in shielded supply to 4.86 million ZEC tokens, pointing to growing demand for privacy.

Crypto’s $638 million buyback boom may not be as bullish as it looks

Decentralized Finance (DeFi) protocols reportedly spent $638 million to buy back their native tokens in August, up 17% from a year earlier. On the surface, the buyback trend suggests the cryptocurrency industry is maturing fast.

Crypto Today: Bitcoin, Ethereum, XRP recovery takes a breather amid capital inflows

Bitcoin corrects lower toward $80,000 after testing highs at $81,269, supported by $731 million in ETF inflows. Ethereum bulls push to regain momentum, with $2,500 providing immediate support.

Bitcoin: Gearing up for a sharp move
Bitcoin (BTC) is trading around $81,000 on Friday, up over 4% so far this week, and awaits a key catalyst that could determine its next directional move. Strong institutional demand is supporting the bullish price action, with spot BTC Exchange Traded Funds (ETFs) on track to record a third straight week of inflows.
Bitcoin Price Analysis: BTC/USD snaps three-day downtrend as traders flirt with $36,000


