|

Bitcoin price analysis: BTC/USD settles above $9,800, vulnerable to new losses

  • BTC/USD has recovered from the intraday low, but bearish sentiments are still strong.
  • The daily RSI supports the short-term bearish scenario.

Bitcoin (BTC) managed to recover above $9,800 after a bloody crash towards $9.600 during early Asian hours. At the time of writing, the first digital asset is changing hands at $9,860, down 3.5% on a day-on-day basis. Bitcoin’s sell-off triggered a carnage on the cryptocurrency market as all major altcoins collapsed from the recent highs. Bitcoin’s market dominance settled at 67.4%.

Bitcoin lost over $400 and crashed below $10,000 in a matter of minutes during early Asian hours amid excessively high volatility. As the coin dropped by more than 5%, the short-term market players had to liquidate their positions, which exacerbated the decline. Thus, several long positions to the tune of $150 million were closed on the leading exchange for cryptocurrency derivatives BitMEX. 

Read details here

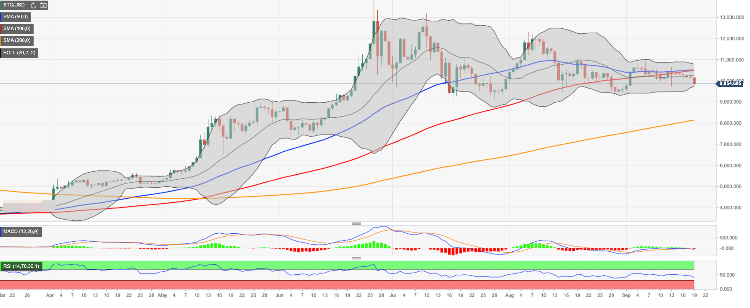
Bitcoin's technical picture

Looking technically, BTC/USD has returned inside the Bollinger Band on a daily chart. $10,000 has turned into a strong resistance that may limit Bitcoin’s recovery in the short-run. Meanwhile, we will need to see a sustainable move above this handle for the upside to gain traction with the next focus on $10,250 ( the middle line of a Bollinger Band on a daily chart). A strong barrier awaits us on approach to $10,500. It is created by a combination of SMA50 (Simple Moving Average) and SMA100 on a daily chart.

On the downside, a move below $9,750 ( the lower line of one-day Bollinger Band) will trigger more sell-off and push the price towards intraday lows of $9,600. This support is followed by $9,300, which is the lowest level from August 30. 

The downward-looking RSI (Relative Strength Index) on a daily chart implies that the bearish trend may gain traction.

BTC/USD, daily chart

Author

Tanya Abrosimova

Tanya Abrosimova

Independent Analyst


More from Tanya Abrosimova
Share:

Editor's Picks

XRP trades under pressure amid weak retail demand

XRP presses down on the 50-day EMA support as risk-averse sentiment spreads despite a positive start to 2026. XRP faces declining retail demand, as reflected in futures Open Interest, which has fallen to $4.15 billion.

Pi Network Price Forecast: PI holds key support as momentum coils

Pi Network (PI) trades close to $0.2100 at press time on Friday, stabilizing after a two-day decline of nearly 2%. The PI token's trading volume steadily declines, while a surge in social dominance suggests a potential spike in retail interest.

Crypto Today: Bitcoin, Ethereum, XRP risk further decline as market fear persists amid slowing demand

Bitcoin holds $90,000 but stays below the 50-day EMA as institutional demand wanes. Ethereum steadies above $3,000 but remains structurally weak due to ETF outflows. XRP ETFs resume inflows, but the price struggles to gain ground above key support.

Bitcoin Weekly Forecast: Early-2026 rally falters as BTC investors await key catalyst

Bitcoin is trading lower toward $90,000 on Friday after encountering rejection at a key resistance zone. The price pullback in BTC is supported by fading institutional demand, as spot Exchange Traded Funds have recorded net outflows so far this week. 

Orange Juice Newsletter – Smart insights by real people. Every day.

A free newsletter highlighting key market trends to help traders stay a step ahead. Daily insights on the most relevant trading topics, compiled by our experts in an easy-to-read format so you never miss an important move.

Bitcoin: Early-2026 rally falters as BTC investors await key catalyst

Bitcoin (BTC) is trading lower toward $90,000 on Friday after encountering rejection at a key resistance zone. The price pullback in BTC is supported by fading institutional demand, as spot Exchange Traded Funds (ETFs) have recorded net outflows so far this week.