|

Bitcoin Price Analysis: BTC is breaking out, record highs back in sight

  • BTC/USD teasing falling wedge breakout on the hourly sticks.
  • 50-HMA could challenge the bulls’ commitment.
  • RSI edges higher above the midline, backing the upside break. 

Bitcoin (BTC/USD) is making another attempt towards the $40,000 mark in early Asian trades, having failed to find acceptance above that level last week.

From a short-term technical perspective, the no.1 coin is on the verge of confirming a falling wedge breakout should the price deliver an hourly closing above the falling trendline resistance at $38,713.

BTC/USD: Upside appears more compelling

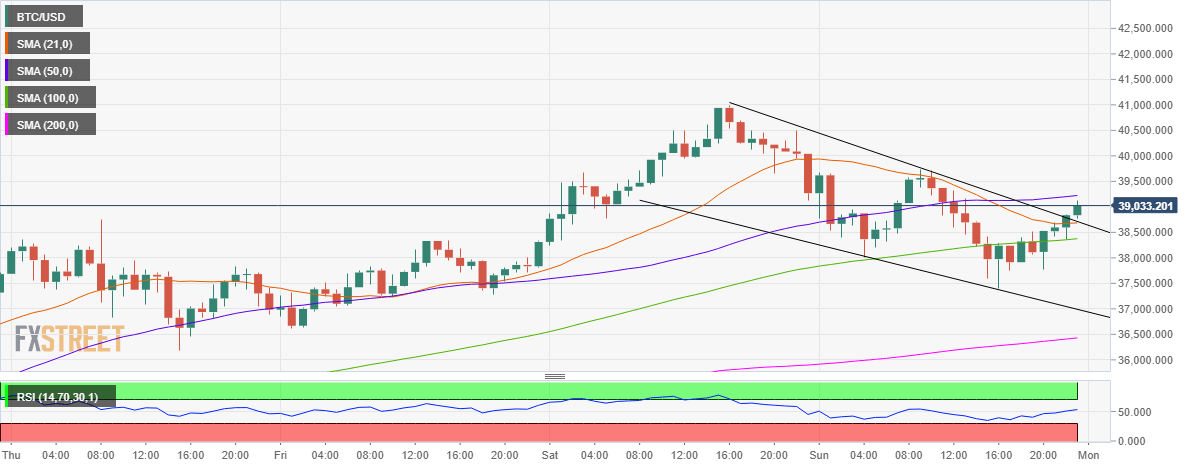
BTC/USD: Hourly chart

The level is the powerful confluence zone, where the 21-hourly moving average (HMA) coincides. On validation of the upside break, the bulls could meet immediate resistance at the 50-HMA of $39,223.

Acceptance above the latter could expose the $40K mark, beyond which the buyers would target Saturday’s high of $40,997 en-route the all-time-highs of $41,987.

The Relative Strength Index (RSI) is holding firmer, currently at 53.29, above the midline. This makes a stronger case for the additional upside.

Alternatively, the abovementioned key confluence area around $38,720 could be tested on any pullbacks.

Further south, the horizontal 100-HMA at $38,376 could be put to test. A sharp sell-off could be in the offing below the latter, opening floors for a test of the falling trendline support at $36,991.

BTC/USD: Additional levels to watch

BTC/USD

Overview
Today last price39042.34
Today Daily Change-225.86
Today Daily Change %-0.58
Today daily open39268.2
 
Trends
Daily SMA2034399.52
Daily SMA5032587.89
Daily SMA10025080.44
Daily SMA20018169.06
 
Levels
Previous Daily High40997.66
Previous Daily Low38247.18
Previous Weekly High38758.32
Previous Weekly Low32206.92
Previous Monthly High41987.21
Previous Monthly Low27772
Daily Fibonacci 38.2%39946.98
Daily Fibonacci 61.8%39297.87
Daily Pivot Point S138011.03
Daily Pivot Point S236753.87
Daily Pivot Point S335260.56
Daily Pivot Point R140761.51
Daily Pivot Point R242254.82
Daily Pivot Point R343511.98

Author

Dhwani Mehta

Dhwani Mehta

FXStreet

Residing in Mumbai (India), Dhwani is a Senior Analyst and Manager of the Asian session at FXStreet. She has over 10 years of experience in analyzing and covering the global financial markets, with specialization in Forex and commodities markets.

More from Dhwani Mehta
Share:

Editor's Picks

Ripple risks extending drop as June lows come into view

Ripple (XRP) ticks down below $1.20 with short-term support at $1.16 intact at the time of writing on Thursday. An early-week rally was rejected at $1.28, weighing on sentiment as traders broadly de-risked.

Crypto Today: Bitcoin, Ethereum and XRP pare losses on increasing bets of Fed tighter monetary policy

Cryptocurrency prices are broadly moderating downwards on Thursday, as market participants assess the impact of the Fed’s hawkish monetary policy stance. Bitcoin edges lower, with support at $64,000 holding.

Bittensor Price Forecast: TAO closes in key support, risking deeper losses

Bittensor price edges below $250 at press time on Thursday, marking its fourth straight day of losses. The AI token is losing retail demand as TAO futures Open Interest dips over 8% in the last 24 hours.

Bitcoin slips below $64,000 as hawkish Fed stance weighs on risk appetite

Bitcoin remains under pressure, extending its correction, trading below $64,000 at the time of writing on Thursday. The US Fed left interest rates unchanged but struck a hawkish tone on Wednesday, dampening the risk sentiment.

Experts agree: Bitcoin nears bottom, but weak demand raises doubts
Bitcoin (BTC) is trading above $63,000 at the time of writing on Friday after rebounding from the key 200-week Simple Moving Average (SMA) near $62,000, a level widely viewed as key long-term support. The recovery may suggest that Bitcoin has found a floor after a sharp correction that spanned more than a month, but some warning signs persist.