Bitcoin price action at inflection point as rally encounters first real hurdle
- Bitcoin price action has laid down a three-day winning streak.
- BTC price could target $20,000 as price action jumps on the back of strong bank earnings in the US.
- With two big price caps nearby, however, the rally could also be cut short anytime.

Bitcoin (BTC) price action is enjoying October’s mild weather, like many households. The feared spike in gas consumption seems to have been delayed for a few weeks leading to some relief amongst both investors and the general population. Additionally, gas prices plunged on Monday, falling back to their lowest levels since June, at the same time releasing some cash that could be invested into cryptocurrencies. Lead crypto Bitcoin along with several other assets also sees its price action at the cusp of breaking above a key technical bearish element.
BTC price set to face the bear devils
Bitcoin looks to be almost fully synchronised with financial markets in general this week. Just as cable, EUR/USD, the Dow Jones and other assets are all nearing key levels or key hurdles to the upside, the existential question arises of whether this rally is the one that will finally end the overall downtrend for 2022. Although many investors remain sceptical, the turnaround ought not to be totally ignored as the broad cash inflow in all assets looks very much supported and thus could be of some importance in the coming weeks or even months.
BTC price action must take out the 55-day Simple Moving Average at $19,750 to keep going higher, as it is acting as the main bearish handle for October. Once that obstacle is taken care of, the next one awaits at the level of the red descending trend line at $19,900. A fade there looks inevitable, but if bulls can keep it together and keep pressing price action upwards, $20,000 could be on the cards, with $20,125 as the next price target, at the level of the monthly pivot.
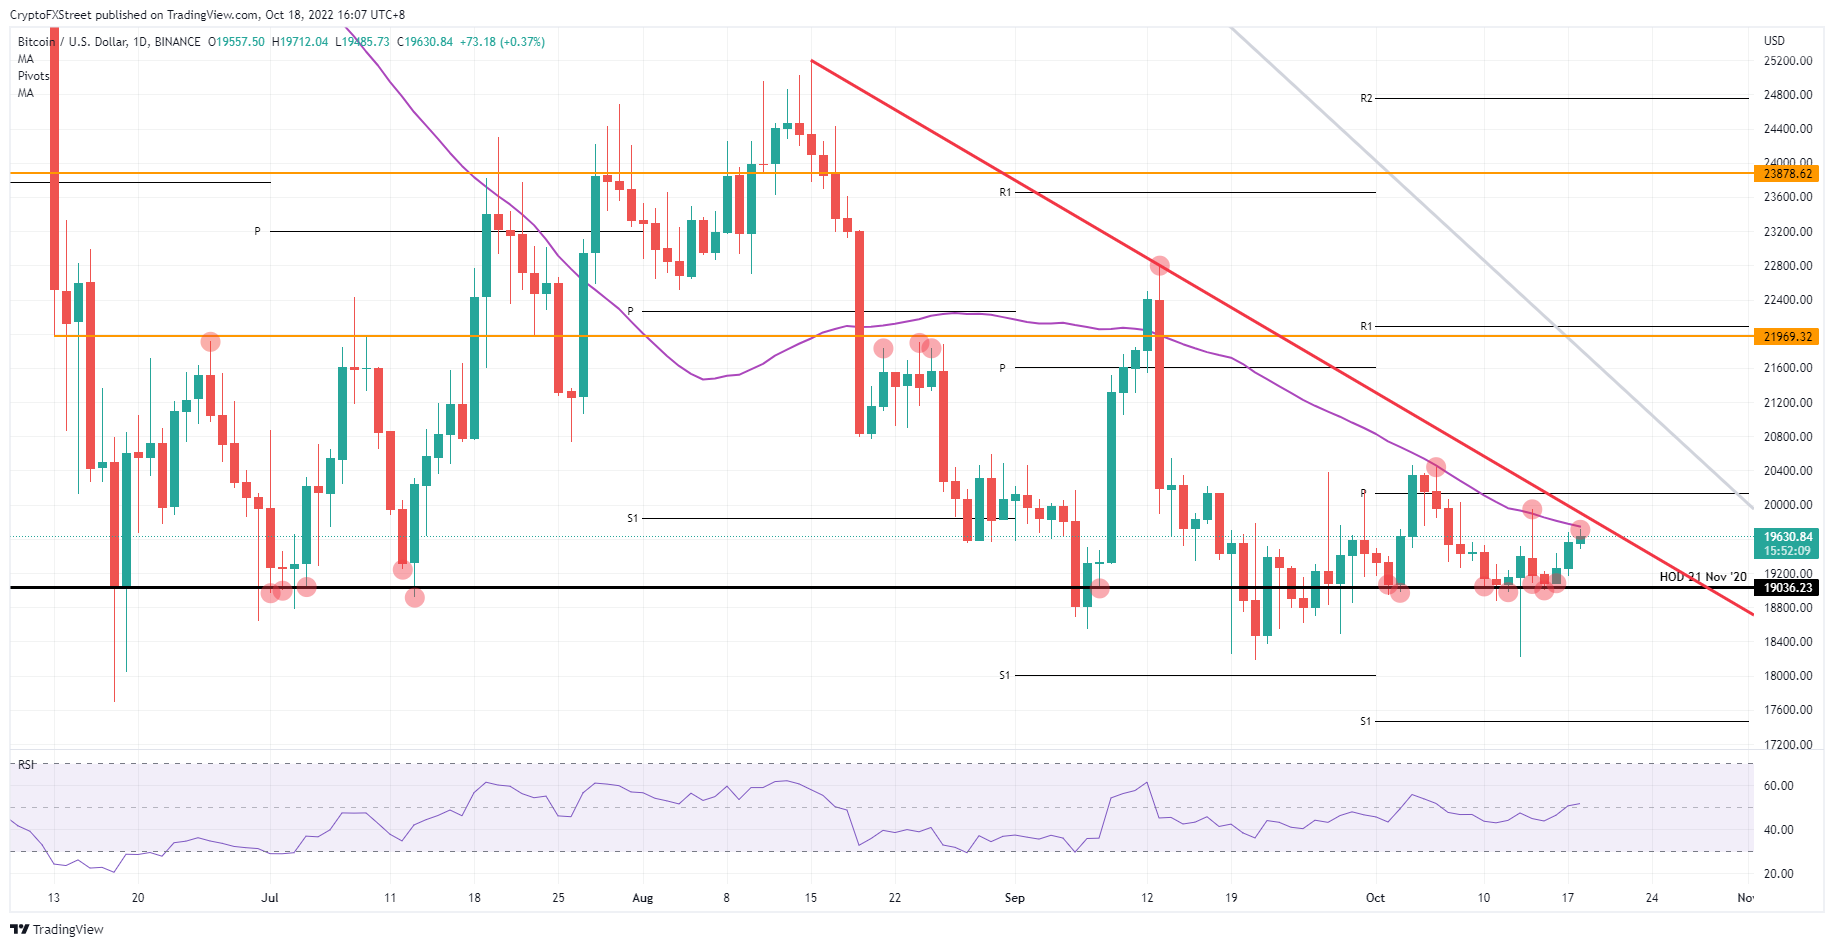
BTC/USD Daily chart
Risk to the downside on the other hand comes from a possible repeat of the peaks in October, where the 55-day SMA rejected price action on two occasions. Both times it pushed price action back down to $19,036. Seeing the multiple tests of that level, a break below again is quite possible and could see price action nearing $18,000 in the coming weeks, especially given that the current macroeconomic backdrop has not fundamentally changed at all.
Author

Filip Lagaart
FXStreet
Filip Lagaart is a former sales/trader with over 15 years of financial markets expertise under its belt.


