Bitcoin market update: BTC/USD bulls paralyzed under $11,400 resistance
- Bitcoin gloomy start of the week enters the second day.
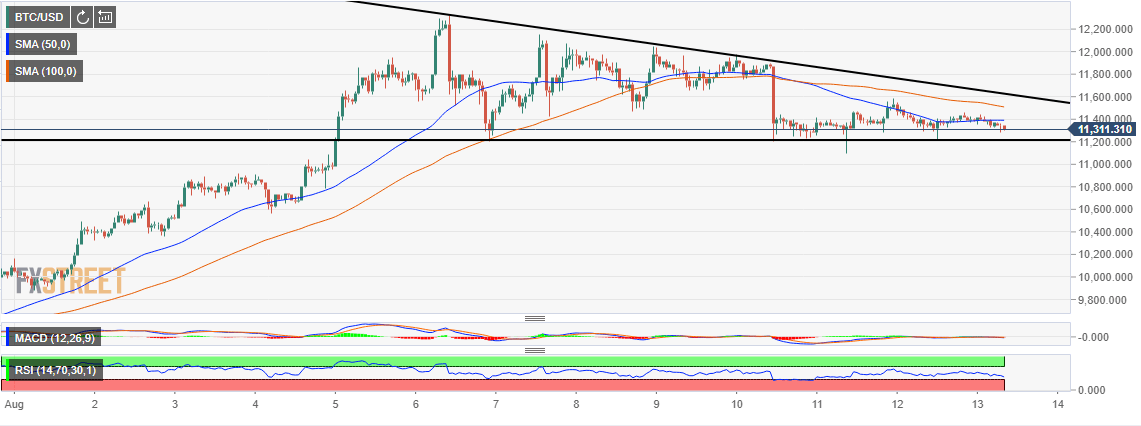
- Bitcoin bulls fight to defend $11,200 support and year to kick the price above $12,000.

Bitcoin bears continue to threaten the key support at $11,200. This follows a gloomy start of the week’s trading despite closing last week’s session in the positive. Bitcoin bears have been throwing tantrums since yesterday. However, the buyers have been yearning to not only sustain the price above but also compel Bitcoin for a spectacular move towards $12,000.
At present, the price is dancing at $11,321 under the 50 Simple Moving Average (SMA) 1-hour chart ($11,400). The passion to trader above $12,000 is present but the actual move will depend on the ability of the buyers to send Bitcoin price out of the falling triangle pattern.
According to the prevailing trend, Bitcoin is inclined to make sideways movements between $11,200 and $11,400. The technical picture emphasizes the impending motion especially as the Moving Average Convergence Divergence (MACD) levels at 0.00.
The bitter truth is that the Relative Strength Index (RSI) gradually slides towards the oversold. As much as no rapid sharp movement is expected, Bitcoin is likely to glide closer to the support.
BTC/USD 1-hour chart
Author

John Isige
FXStreet
John Isige is a seasoned cryptocurrency journalist and markets analyst committed to delivering high-quality, actionable insights tailored to traders, investors, and crypto enthusiasts. He enjoys deep dives into emerging Web3 tren


