Bitcoin eyes $60k as active entities surge, price chart shows impending bull cross

Bitcoin’s rally looks to have legs as the ascent is backed by a pickup in blockchain activity and a long-term technical indicator which is about to turn bullish.
-
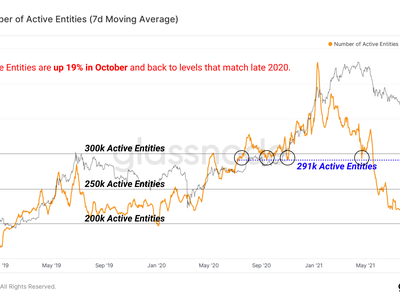
While bitcoin has gained 30% this month, the user activity on the network, as measured by the seven-day average of the number of active entities, has increased 19% to 284,179, according to data provided by Glassnode.
-
An increase in network adoption along with a price increase is said to confirm the uptrend.
-
According to Glassnode, “more active market participants has historically correlated with growing interest in the asset during early-stage bull markets.”
-
Glassnode defines active entities as a “cluster of addresses controlled by the same network entity.” The metric includes both businesses like exchanges and custodians and individuals.
-
The current tally of active entities is the highest in five months and at par with the number observed at the beginning of the bull run in late 2020.
-
Institutional participation has increased along with network adoption, as evidenced by the uptick in the median size of on-chain transactions from 0.6 BTC to 1.3 BTC since September.
-
“An increased typical transaction size is not synonymous with price appreciation, but indicative of larger and even institutional sized capital flows present on-chain,” Glassnode said, adding that the dollar value of transaction size has also increased.
-
The technical outlook appears to be in sync with the bullish on-chain data, with the 100- and 200-day moving average (MA) on track to print a bullish crossover in the next few days – the first in 16 months.

-
A bull cross occurs when a particular moving average crosses above another average tracking a relatively higher number of backward-looking data.
-
The impending bull cross of the 100- and 200-day MAs is widely taken to represent a long-term bull market and may soon invite stronger chart-driven buying pressure.
-
A 10-month bull run from $8,300 to $64,801 followed the previous bullish signal confirmed in June 2020. The cryptocurrency nearly doubled to $13,880 after the bull cross of 100- and 200-day MAs in early May 2019.
-
Moving average crossovers, whether bullish or bearish, are not always reliable. These are lagging indicators and sometimes trap traders on the wrong side of the market. For instance, bitcoin bottomed out near $30,000 following the confirmation of the bear cross of 100- and 200-day MAs can mid-July.
Author

CoinDesk Analysis Team
CoinDesk
CoinDesk is the media platform for the next generation of investors exploring how cryptocurrencies and digital assets are contributing to the evolution of the global financial system.


