Bitcoin extends correction below the $60,000 level
- Bitcoin corrects on Monday, down nearly 1% as it settles back under the $60,000 level.
- Crypto Fear and Greed Index flashes “fear” as Bitcoin erases recent gains.
- Bitcoin traders continue to take profits, with nearly $720 million in profits realized in the last six days.

Bitcoin (BTC) extends correction and erases Friday’s gains after being unable to hold above the psychologically important $60,000 level over the weekend. Since Saturday’s opening, BTC erased nearly 3% of its value and trades near $58,500 at the time of writing on Monday.
The crypto Fear and Greed Index, which measures the sentiment among market participants on a scale of 0 to 100, shows “fear” among traders.
Bitcoin loses value over the weekend and Monday
Bitcoin, the largest cryptocurrency by market capitalization, has been correcting since the weekend. BTC suffered a drop after being unable to hold above the psychological level of $60,000.
The Crypto Fear and Greed Index turned neutral when Bitcoin made a comeback above $60,000 on Friday. Since the asset’s dip below the key level over the weekend, the Index is back at “fear” levels. This shows the importance of the $60,000 price level for the asset’s traders.
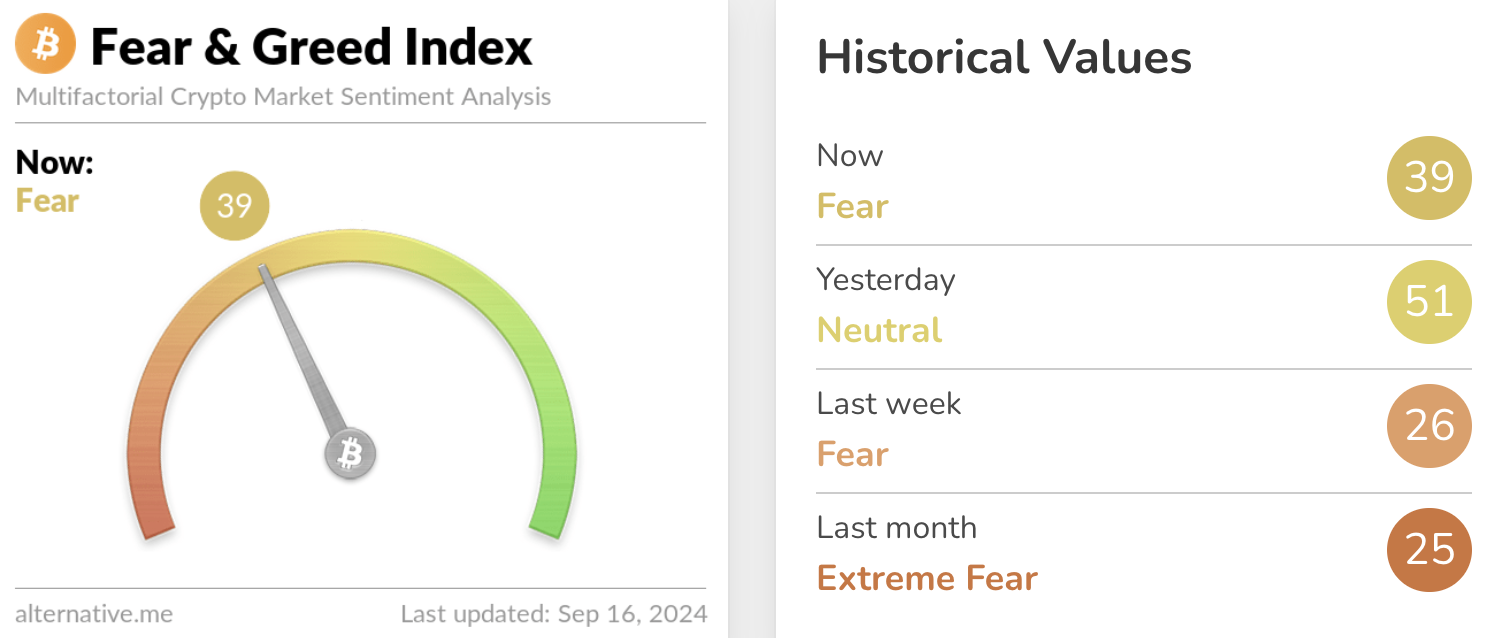
Bitcoin Fear & Greed Index
Data from crypto intelligence tracker Santiment shows that Bitcoin traders have consistently taken profits, nearly $720 million in realized gains between September 10 and 16, at the time of writing, as measured by the Network Realized Profit/Loss metric (NPL), which tracks the net realized profit/loss of all tokens traded in a day.
Large-scale profit-taking could push prices lower since it increases selling pressure on BTC.
 [12.55.52, 16 Sep, 2024]-638620887169960798.png)
Bitcoin price and NPL
Where is Bitcoin headed?
Bitcoin could extend losses and sweep liquidity at the lower boundary of the Fair Value Gap (FVG) between $55,318 and $56,386. From the current level, BTC could erase nearly 6% of its value to reach the target of $55,318, the September 8 high.
The Relative Strength Index (RSI), a momentum indicator, hovers above 50 on the daily timeframe at 50.40. RSI at 50 marks the neutral level, meaning Bitcoin is neither overbought nor oversold and signalling a lack of directional momentum.
The Moving Average Convergence Divergence (MACD) indicator shows green histogram bars above the neutral line, signaling underlying positive momentum in Bitcoin’s price trend. Bitcoin could try a recovery once it sweeps liquidity in the imbalance zone and attempts a rally to the $60,000 level, a psychological barrier.
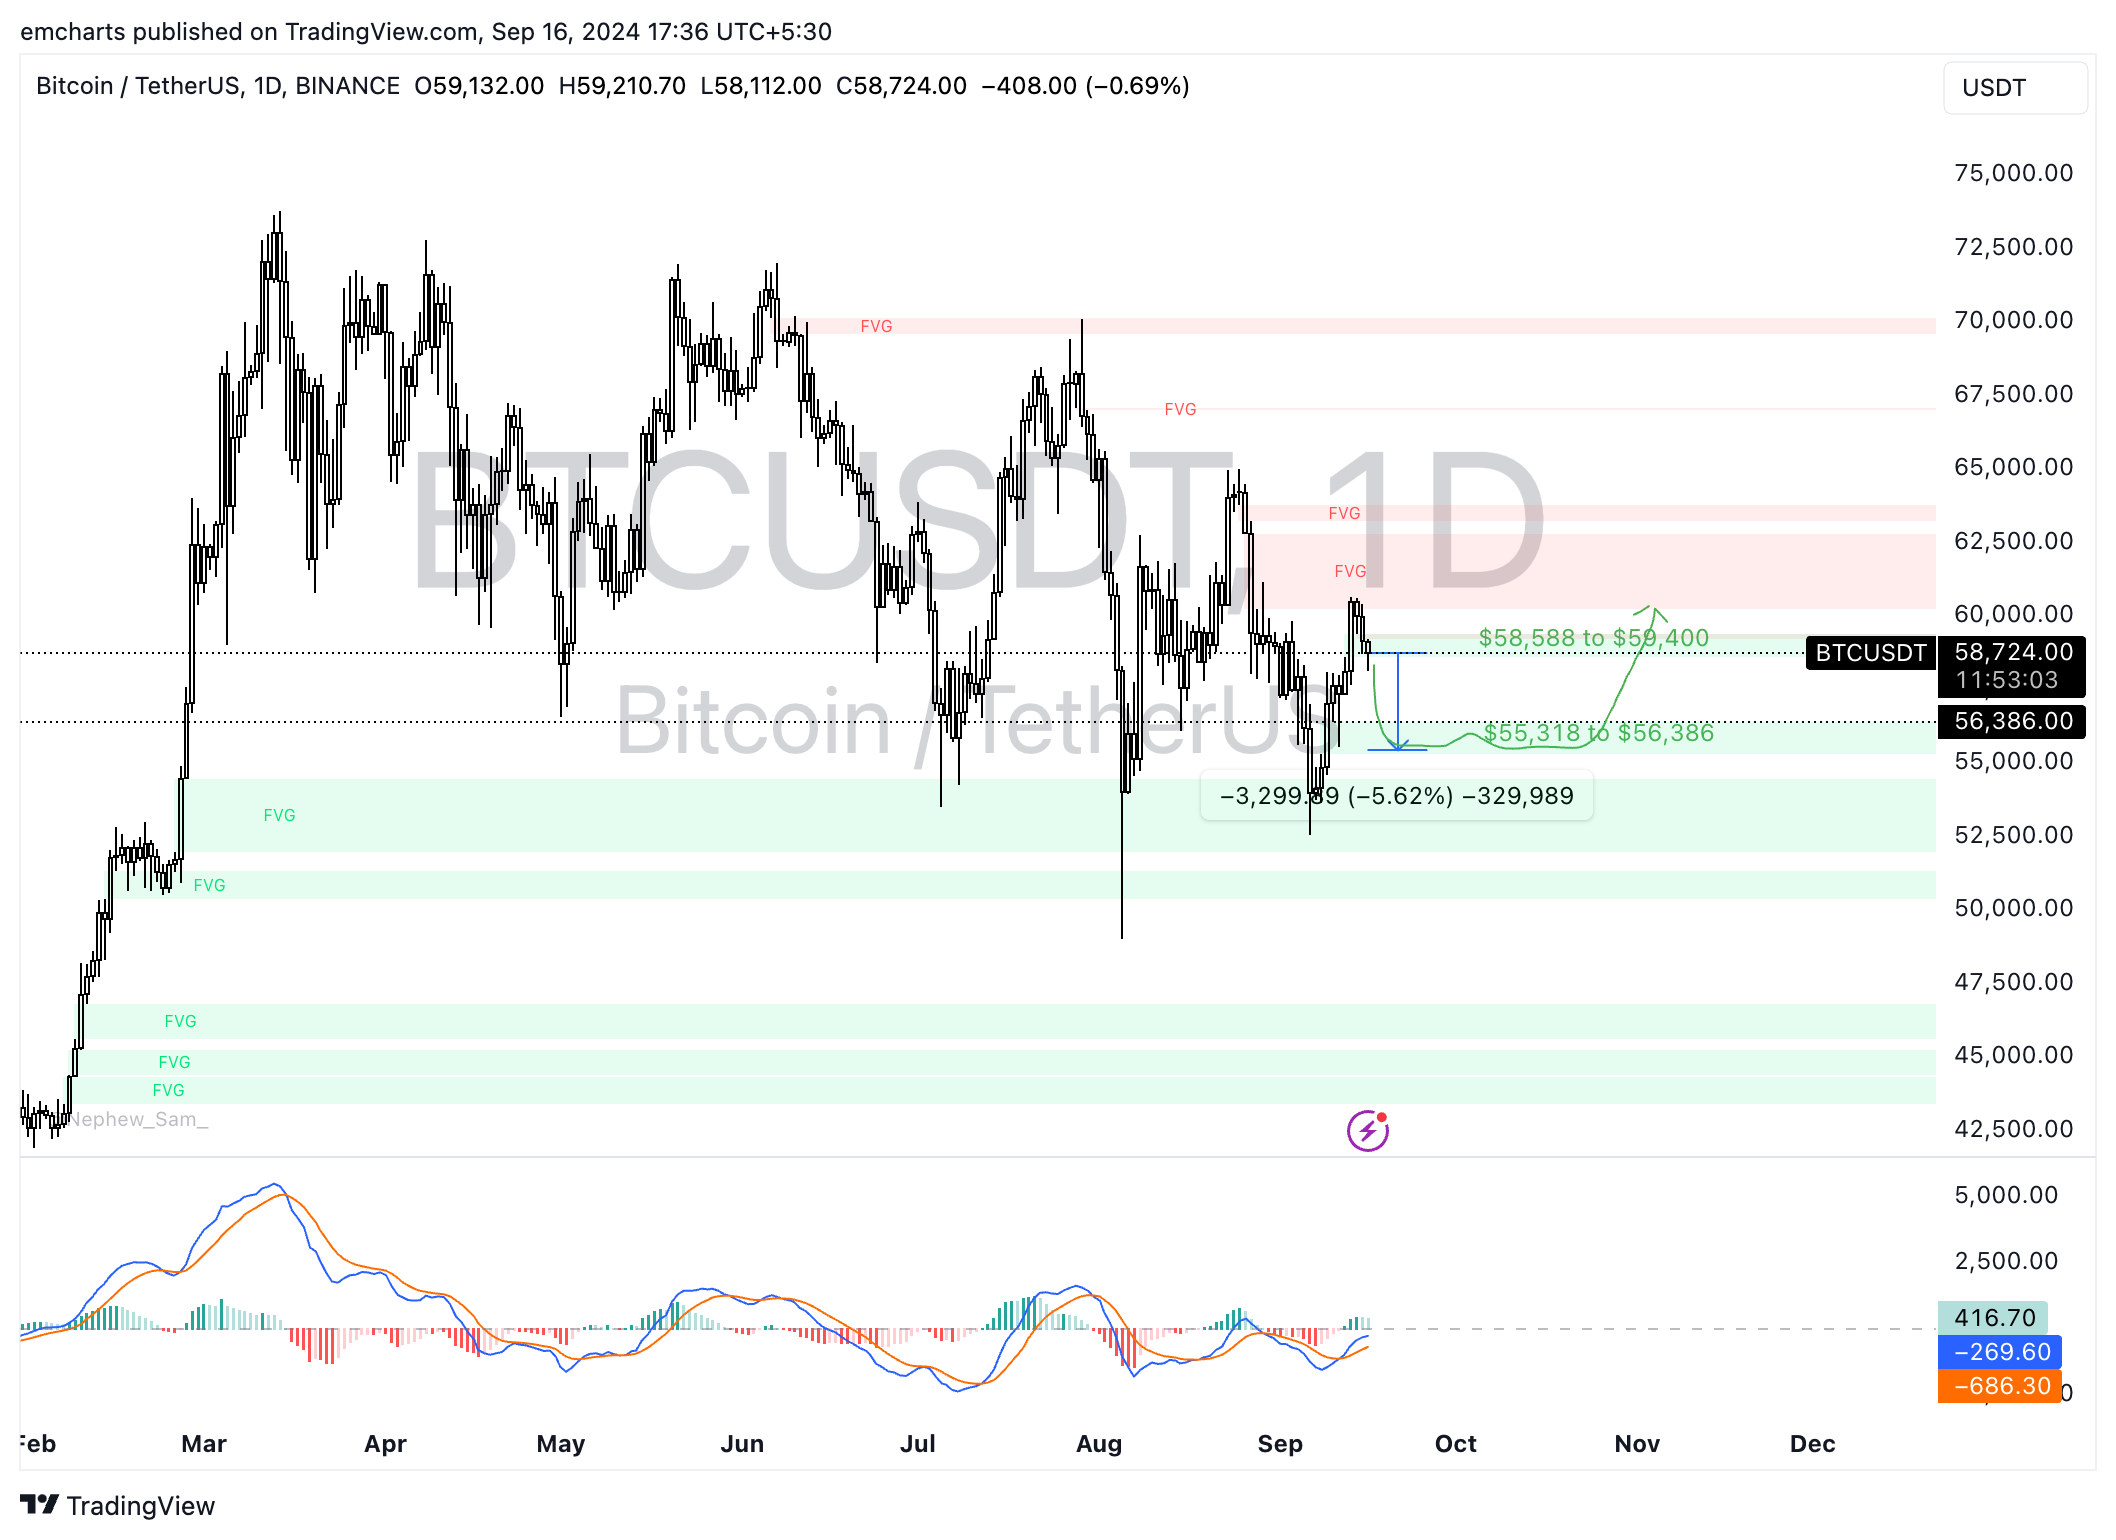
BTC/USDT daily chart
Looking down, BTC could find support at the September 6 low of $52,550, this marks the lowest level for Bitcoin this month.
Author

Ekta Mourya
FXStreet
Ekta Mourya has extensive experience in fundamental and on-chain analysis, particularly focused on impact of macroeconomics and central bank policies on cryptocurrencies.



