![]() Matt Simpson, CFTe, MSTA
Matt Simpson, CFTe, MSTA
CityIndex
Bitcoin has been grabbing the limelight once more as it breaks through key levels like a knife through butter. Having travelled 20% yesterday alone, we've analysed how the crypto currency has performed on previous occasions following such levels of volatility.
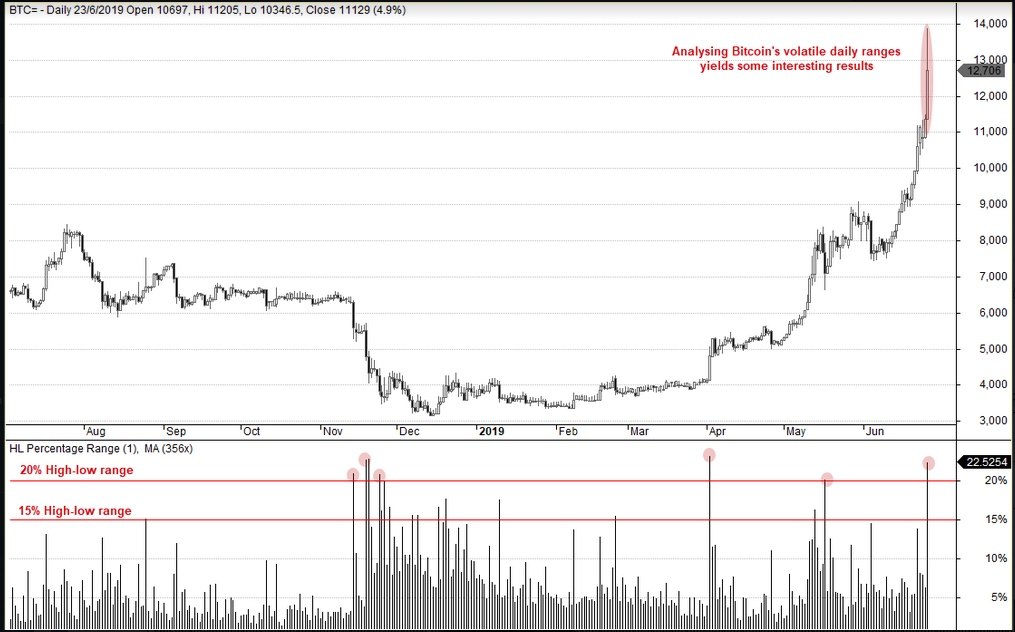
It’s no secret the Bitcoin (BTC) and other crypto currencies are highly volatile vehicles, which can post eye watering numbers when compared with other instruments. For example, BTC has rallied over 80% since the June low just three ago, and even this pales in comparison to 326% appreciation since December’s low to yesterday’s high. Just yesterday, Bitcoin’s daily range exceeded 20%, a threshold which could be the difference between a bull or a bear market to other assets. With that in mind, we’ll take a closer look at how Bitcoin has behaved under such volatile conditions.
Using data going since July 2014:
-
There have been 38 sessions where Bitcoin’s daily range was >=20%.
-
Of these 38 days, 36.9% were bullish (63.2% were bearish)
-
From this sample, the largest bullish close was 22.4% (largest bearish day was -24.5%)
From this we see that:
-
Nearly 2/3 of daily ranges >=20% were bearish
-
The most bullish day from the sample was larger than the most bearish
-
Such levels of single-day volatility have been favourable to the bear-camp.
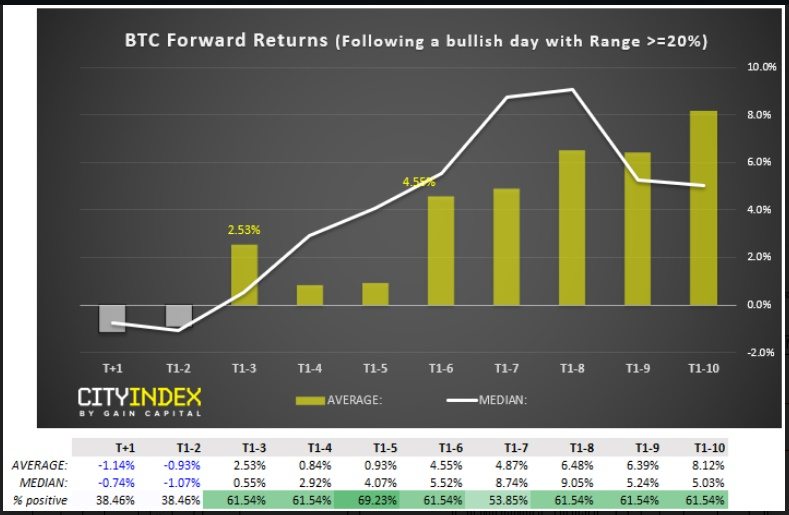
However, as the trend is undeniably bullish and yesterday closed nearly 12% higher, we’d like to drill down into the data to see Bitcoins forward returns following bullish days with a range >=20%. For clarity, forward returns measure the performance of a market following a particular event, using historical data.
T+1: % return next day
T+1-2: % Returns over the next 2 days
Following bullish days with a high-low range >= 20%:
-
On average, the following day produced negative returns of -1.14%, and closed lower 61.5% of the time
-
After two days, bitcoin averaged -0.93% return and closed lower 61.5% of the time
-
On average, positive returns were seen with hold times between 3 and 10 days after the event
-
Typically, the average return increases over time towards a 10-day hold after the event
-
Average returns peaked after 10-days of holding
-
Media (typical returns) peak around 8 days later (just over a week)
It’s worth noting at this stage that there have only been 13 days that fit our criteria. Statistically speaking, we’d want at least 30 occurrences at a minimum to be confident the results were valid. However, if we drop the threshold to 15% high-low range, the sample size becomes 33 and similar patterns emerge.
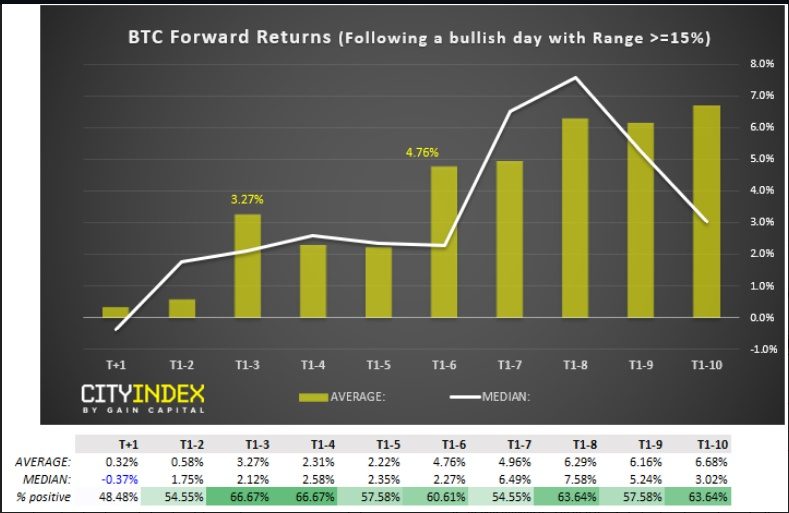
Following bullish days with a high-low range >= 15%:
-
On average, all holding periods produced a positive return
-
10-days holding period produced the highest, average return
-
Median (typical) average return peaks at 8 days
And, to drill down a little further, we look at average returns on a day by day basis.
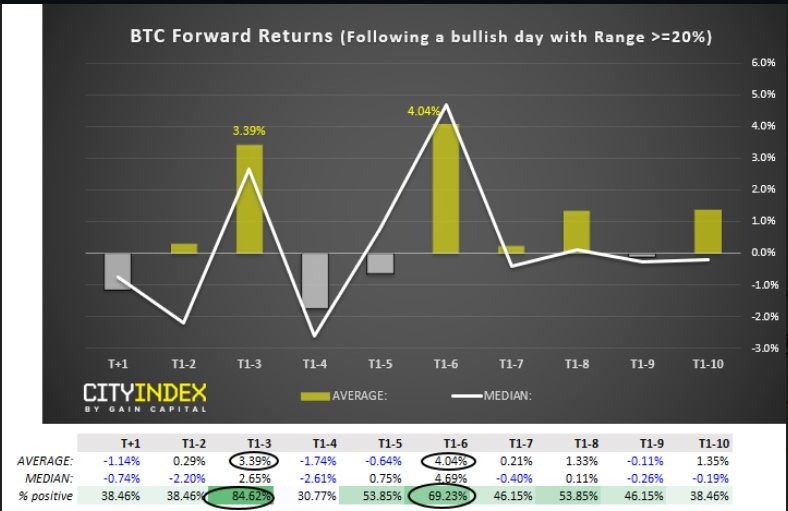
Following bullish days with a high-low range >= 20%:
-
The highest % return occurred on day 6 (T+6)
-
The 2nd highest % return occurred on day 3 (T+3)
-
The 3rd day closed higher 84.6% of the time
-
The 6th day closed higher 69.2% of the time
So from this data-set, day 3 and 6 after the event were the most profitable. And if we re-run the test using a >=15% threshold (to increase the sample to 33) then the results are similar, only the returns are smaller.
Summary:
Overall, it suggests that on average, bullish sessions with a range >=15% or >=20% lead to a positive return on day 3 or 6. Furthermore, holding between days 3 to 10 yields an increasing positive return.
Of course, past results are not indicative of the future – but there are some interesting numbers here none the less.
CFD and forex trading are leveraged products and can result in losses that exceed your deposits. They may not be suitable for everyone. Ensure you fully understand the risks. From time to time, City Index Limited’s (“we”, “our”) website may contain links to other sites and/or resources provided by third parties. These links and/or resources are provided for your information only and we have no control over the contents of those materials, and in no way endorse their content. Any analysis, opinion, commentary or research-based material on our website is for information and educational purposes only and is not, in any circumstances, intended to be an offer, recommendation or solicitation to buy or sell. You should always seek independent advice as to your suitability to speculate in any related markets and your ability to assume the associated risks, if you are at all unsure. No representation or warranty is made, express or implied, that the materials on our website are complete or accurate. We are not under any obligation to update any such material. As such, we (and/or our associated companies) will not be responsible or liable for any loss or damage incurred by you or any third party arising out of, or in connection with, any use of the information on our website (other than with regards to any duty or liability that we are unable to limit or exclude by law or under the applicable regulatory system) and any such liability is hereby expressly disclaimed
Recommended Content
Editors’ Picks
Crypto traders brace for short-term volatility with $2.4 billion options expiry on Friday

Bitcoin and Ethereum options market looks bullish on Friday, according to data from intelligence tracker Greeks.live. The firm said it has identified two Bitcoin calls that show an underlying bullish sentiment among market participants.
XRP recovers from week-long decline following Ripple’s response to SEC motion

Ripple filed a letter to the court to support its April 22 motion to strike new expert materials. The legal clash concerns whether SEC accountant Andrea Fox's testimony should be treated as a summary or expert witness.
Lido adds 4% gains as protocol rolls out first step towards decentralization
Lido takes the first batch of simple DVT validators to live, a step taken to decentralize the protocol. Lido leveraged technology to expand the protocol to multiple node operators, inviting both solo and community stakers.
Bitcoin Weekly Forecast: Should you buy BTC here? Premium

Bitcoin (BTC) price shows signs of a potential reversal but lacks confirmation, which has divided the investor community into two – those who are buying the dips and those who are expecting a further correction.
Bitcoin: Should you buy BTC here? Premium
Bitcoin (BTC) price shows signs of a potential reversal but lacks confirmation, which has divided the investor community into two – those who are buying the dips and those who are expecting a further correction.