Bitcoin cracks $12,000, can Ethereum and XRP follow the steps of BTC?
- BTC briefly jumped above the critical resistance level at $12,000 for the first time since September 1.
- XRP and ETH are not reacting to the recent move just yet.

Bitcoin has been facing a tough psychological resistance level at $12,000 several times in the past on June 24, 2019, August 2019, and more recently in August 2020. Once again, the flagship cryptocurrency made an attempt to stay above $12,000 but other coins remain flat.
Can Ethereum step up to Bitcoin again?
Bitcoin’s dominance over the market increased by 2.3% within the past week after a robust rally to $12,000. Ethereum, on the other hand, is down 4% in the past 24 hours and it’s not showing the same bullish signs as the flagship cryptocurrency.
Back on July 20, Ethereum was the first cryptocurrency to see a massive breakout and Bitcoin followed it shortly after, cracking $10,000. Now, it seems to be the other way around with Ethereum waiting for Bitcoin to cool off before making its own move.
ETH/USD 4-hour chart
-637388254075490810.png)
On the 4-hour chart, the price of ETH slipped below the 50-SMA and it’s currently fighting to stay above the 100-SMA. Bears are also close to confirming a downtrend if the support level at $365 is broken.
Furthermore, it seems that the MACD turned bearish and it’s gaining a lot of strength. A breakout below $365 can push Ethereum down to the 200-SMA at $360 and then to the low of $334 formed on October 9.
ETH/USD daily chart
-637388254168152619.png)
Nonetheless, on the daily chart, bulls are defending the 50-SMA after turning the other two into support levels. The price also established several higher lows and higher highs confirming an uptrend, however, Bitcoin continues dominating.
ETH IOMAP Chart
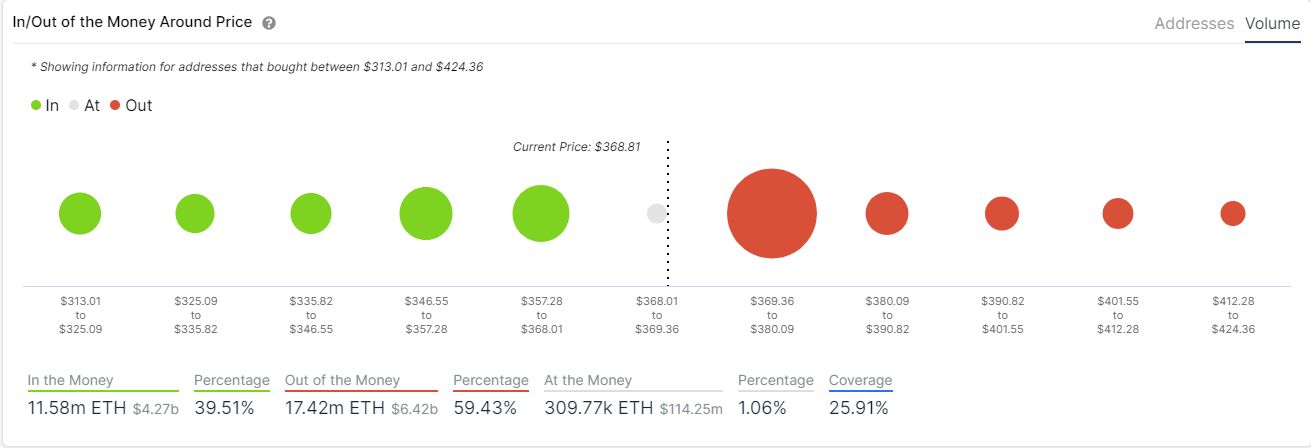
The In/Out of the Money Around Price chart only shows one robust resistance area between $369 and $380 with 14 million ETH in volume. A breakout above $380 can easily drive the digital asset towards $400 and then the 2020-high at $480 as there isn’t much resistance to the upside.
XRP on the verge of a massive breakout
Despite the strength of Bitcoin, it seems that XRP was also not positively affected by it. The digital asset is currently trading at $0.243 still inside a long-term symmetrical triangle. The pattern is extremely close to a breakout that could happen within the next 2-3 days.
XRP/USD daily chart
-637388254451451991.png)
The symmetrical triangle is the most significant pattern developed on the daily chart. Bulls have just lost the 50-SMA and they lost the 100-SMA around one week ago. It seems that the bears have the upper hand in the short-term as the pattern gets closer to its conclusion.
The MACD also turned bearish on October 16 and indicates a bearish breakout is more likely. The lower boundary of the pattern is established at $0.243, which means that a slip below this level can send the digital asset down to the 200-SMA at $0.225 and as low as $0.195.
XRP/USD 1-hour chart
-637388254567708824.png)
The good news for the bulls is the successful defense of the 100-SMA support level on the hourly chart which is now established as a robust support point. The price is already bouncing towards the 50-SMA and the MACD is close to a bull cross.
Again, the most important breakout point would be above the upper trendline of the symmetrical triangle formed on the daily chart at $0.25. Climbing above this level can push XRP up to $0.30 quite easily as the bulls face very little resistance.
Critical price points for Ethereum and XRP
Although Ethereum is a bit flat right now, a breakout above $380 can easily drive the digital asset towards $400 and up to $480 as there isn’t much resistance to the upside. For XRP, the most important breakout point to the upside is $0.25 which can drive the digital asset to $0.30.
On the other hand, Ethereum faces some short-term selling pressure. A breakout below $365 can push Ethereum down to $360 and $334. XRP bears are keeping an eye on the lower trendline of the symmetrical triangle formed on the daily chart at $0.243, a slip below this level can lead the digital asset to $0.225 and as low as $0.195.
Author

Lorenzo Stroe
Independent Analyst
Lorenzo is an experienced Technical Analyst and Content Writer who has been working in the cryptocurrency industry since 2012. He also has a passion for trading.


