- The world’s 5th most favorite cryptocurrency is down 20+% on the week.
- Range play intact, as bears await fresh impetus for the next leg lower.
The recovery from seven-month lows of 195.13 lost legs on Saturday near 218.50, as Bitcoin Cash (BCH/USD), currently trades around the 210 level, in absence of the weekend love this Sunday. The coin trades around a flat line, having hit a daily high of 216.70 and a daily low of 207.88. With the latest decline, the price trades 2+% lower on a daily basis while rising 3% over the last 24 hours. The market capitalization for BCH stands at $ 3.85 billion.
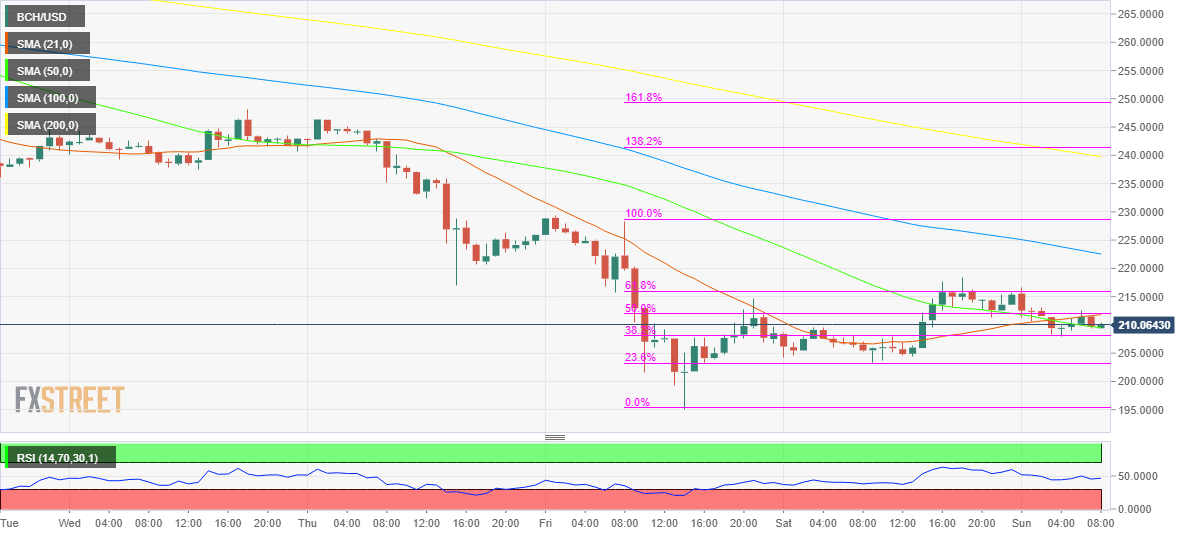
BCH/USD 1-hour chart
As observed on the hourly sticks, the price failed once again to take out the 61.8% Fibonacci Retracement level of Friday’s decline, placed near the 216.10 region on Sunday. Since then, the sellers are in charge, having driven the coin back below the 50% Fib level at 212.10. The No. 5 coin continues to trade in a tight range over the last hours, stuck between the now 50% Fib resistance and 38.2% Fib support around 208.00. The upward-sloping 21-hourly Simple Moving Average (HMA) near 212 region continues to restrict the price-action while the hourly Relative Strength Index (RSI) trades flatlined right at the 50 level. This suggests neutral bias in the near-term. However, with heavy-looking crypto markets, the bearish pressure on the coin will remain intact going forward.
Any recovery is likely to be limited by the 61.8% Fib level. However, if the bulls are successful to regain the last, they are likely to extend the break higher towards the downward sloping 100-HMA, located at 222.55.
BCH/USD Levels to watch
Information on these pages contains forward-looking statements that involve risks and uncertainties. Markets and instruments profiled on this page are for informational purposes only and should not in any way come across as a recommendation to buy or sell in these assets. You should do your own thorough research before making any investment decisions. FXStreet does not in any way guarantee that this information is free from mistakes, errors, or material misstatements. It also does not guarantee that this information is of a timely nature. Investing in Open Markets involves a great deal of risk, including the loss of all or a portion of your investment, as well as emotional distress. All risks, losses and costs associated with investing, including total loss of principal, are your responsibility. The views and opinions expressed in this article are those of the authors and do not necessarily reflect the official policy or position of FXStreet nor its advertisers. The author will not be held responsible for information that is found at the end of links posted on this page.
If not otherwise explicitly mentioned in the body of the article, at the time of writing, the author has no position in any stock mentioned in this article and no business relationship with any company mentioned. The author has not received compensation for writing this article, other than from FXStreet.
FXStreet and the author do not provide personalized recommendations. The author makes no representations as to the accuracy, completeness, or suitability of this information. FXStreet and the author will not be liable for any errors, omissions or any losses, injuries or damages arising from this information and its display or use. Errors and omissions excepted.
The author and FXStreet are not registered investment advisors and nothing in this article is intended to be investment advice.
Recommended Content
Editors’ Picks
TRON gains 10% in 2024, supply of stablecoins reaches over $50 billion in Q1

TRON, a blockchain-based digital platform, has seen positive growth in the first quarter of 2024, as seen in a Messari report. TRON noted gains across several metrics like market capitalization, revenue and total value locked.
XRP hovers near $0.50 as Ripple CTO addresses concerns related to stablecoin launch

XRP is hovering near $0.53 on Friday, spending nearly all week below $0.55. Ripple CTO David Schwartz addressed concerns on stablecoin and XRP utility on Thursday.
Terraform Labs set to restrict access for users in the US after recent ruling in SEC lawsuit

Blockchain company Terraform Labs said Thursday that it will restrict access to some of its products and services for US-based users as it expects to receive a court order soon in light of its legal battle against the US Securities and Exchange Commission (SEC).
Bitcoin Weekly Forecast: BTC’s next breakout could propel it to $80,000 Premium

Bitcoin’s (BTC) recent price consolidation could be nearing its end as technical indicators and on-chain metrics suggest a potential upward breakout. However, this move would not be straightforward and could punish impatient investors.
Bitcoin: BTC’s next breakout could propel it to $80,000 Premium
Bitcoin’s (BTC) recent price consolidation could be nearing its end as technical indicators and on-chain metrics suggest a potential upward breakout. However, this move would not be straightforward and could punish impatient investors.