Bitcoin Cash price is poised for a decline if it breaks below the key support level
- Bitcoin Cash price finds resistance at the 50-week EMA of around $350, signaling an impending decline.
- On-chain data shows that BCH's OI-Weighted Funding Rate is negative, suggesting a bearish trend.
- A weekly candlestick close above $378 would invalidate the bearish thesis.

Bitcoin Cash (BCH) has faced multiple rejections by the 50-week Exponential Moving Average (EMA) of around $350.2. This week, it experienced a 9% decline to trade at $324.2 on Thursday. On-chain data highlights the continuation of the downward trend as BCH's OI-Weighted Funding Rate is negative.
Bitcoin Cash is set for a downleg if it closes below key support level
Bitcoin Cash's price has faced multiple rejections by the 50-week Exponential Moving Average (EMA) of around $350.2. This week, it experienced a 9% decline to trade at $324.2 on Thursday and is approaching the support zone, which ranges from $299.7 to $280.6. This zone is significant for weekly and monthly support.
If BCH closes below $280.6 and breaks below the ascending trendline (drawn by connecting multiple lows from early June 2023), it could crash 23% to retest the December 11, 2023, weekly low of $210.1.
The weekly chart's Relative Strength Index (RSI) and the Awesome Oscillator (AO) have slipped below their respective neutral levels of 50 and zero. This suggests continued momentum favoring bears, potentially leading to a further decline in the Bitcoin Cash price.
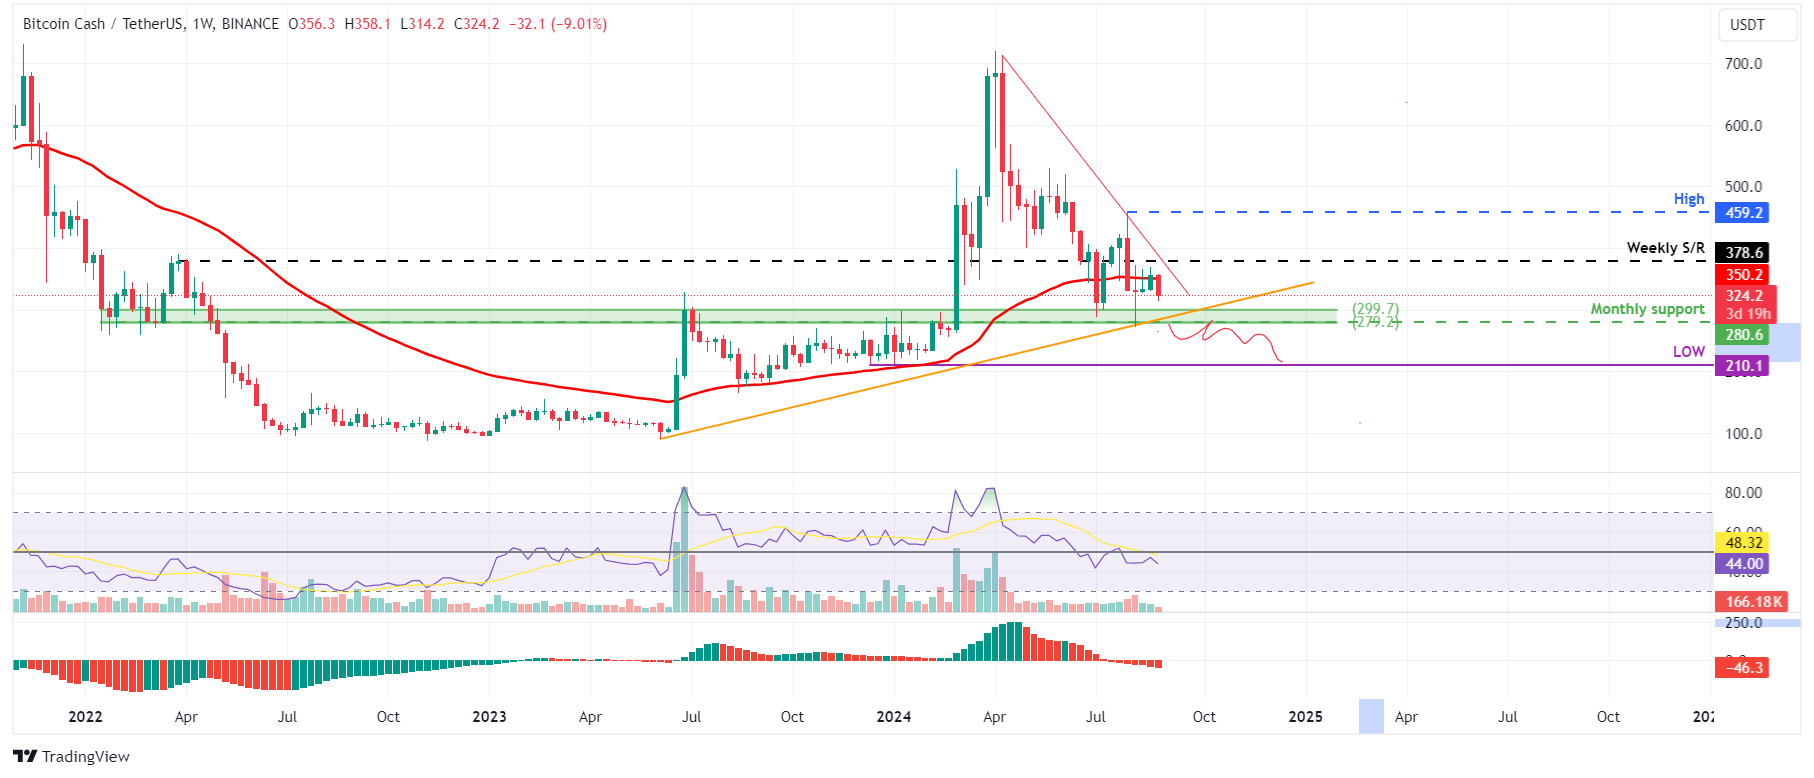
BCH/USDT weekly chart
Coinglass's OI-Weighted Funding Rate data is a crucial metric for traders and analysts to assess market sentiment and predict future price movements. This metric relies on funding rates from futures contracts, weighted by their open interest. A positive rate (longs pay shorts) typically signals bullish sentiment as long positions compensate shorts. Conversely, a negative rate (shorts pay longs) indicates bearish sentiment, with shorts compensating longs.
In BCH's case, this metric stands at -0.026%, reflecting a negative rate and indicating that shorts pay longs. This scenario often signifies bearish sentiment in the market, suggesting potential downward pressure on Bitcoin Cash's price.
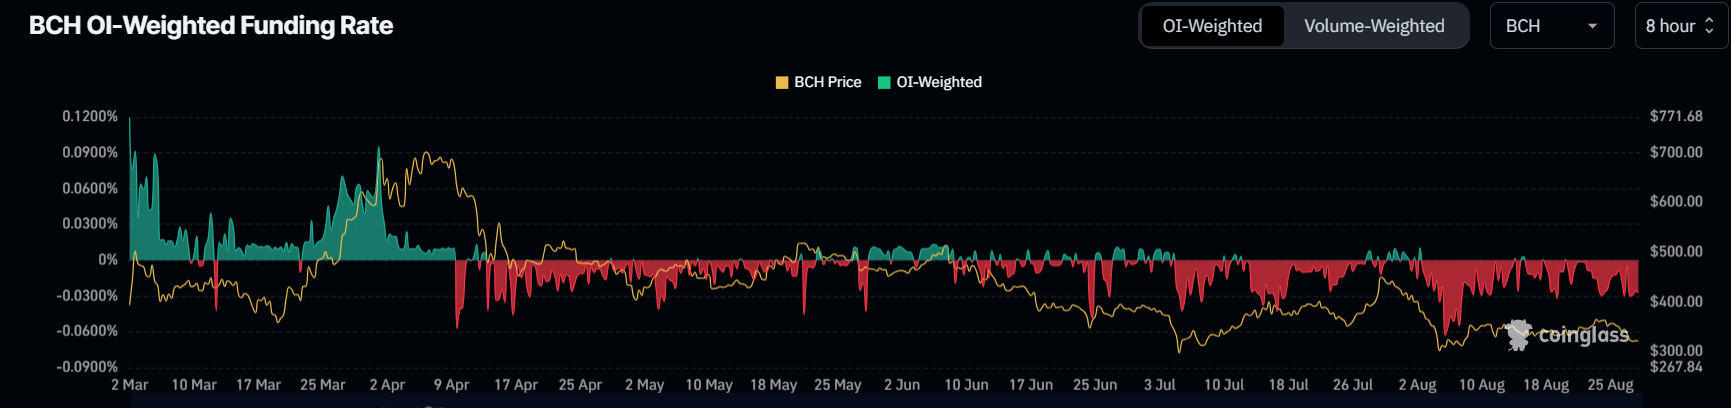
BCH OI-Weighted Funding Rate chart
However, if BCH breaks above the 50-week EMA and closes above the $378 weekly resistance level, it could indicate that bullish sentiment could still make a comeback. Such a development could trigger a 19% rally in Bitcoin Cash's price to revisit its July 29 weekly high of $459.2.
Author

Manish Chhetri
FXStreet
Manish Chhetri is a crypto specialist with over four years of experience in the cryptocurrency industry.


