Bitcoin Cash Price Forecast: Technical and on-chain metrics suggest a rally ahead
- Bitcoin Cash price is nearing the descending trendline; a successful close would suggest a bullish move ahead.
- On-chain data paints a bullish picture, as BCH’s long-to-short ratio is above one, and its funding rate is positive.
- A daily candlestick close below $338.6 would invalidate the bullish thesis.

Bitcoin Cash (BCH) continues to trade in green on Tuesday and is approaching its descending trendline; a successful close would suggest a bullish move ahead. On-chain data further supports the bullish thesis, as BCH’s long-to-short ratio is above one, and its funding rate is positive, all hinting at a possible rally ahead.
Bitcoin Cash is poised for a rally if it closes above the descending trendline
Bitcoin Cash’s price trades slightly above $376.6 on Thursday, trying to break above the descending trendline (drawn by connecting multiple high levels since mid-May), which has acted as resistance multiple times. With a successful break above the trendline and a close above the daily resistance level of $376.6, BCH could rally 22% to retest its July 29 high of $459.2.
The Moving Average Convergence Divergence (MACD) indicator on the daily chart is about to flip a bullish crossover. If the MACD line (blue line) moves above the signal line (yellow line), it will give a buy signal, suggesting upward momentum.
The daily chart’s Relative Strength Index (RSI) reads 60, pointing upwards, reflecting that bullish momentum is gaining traction.
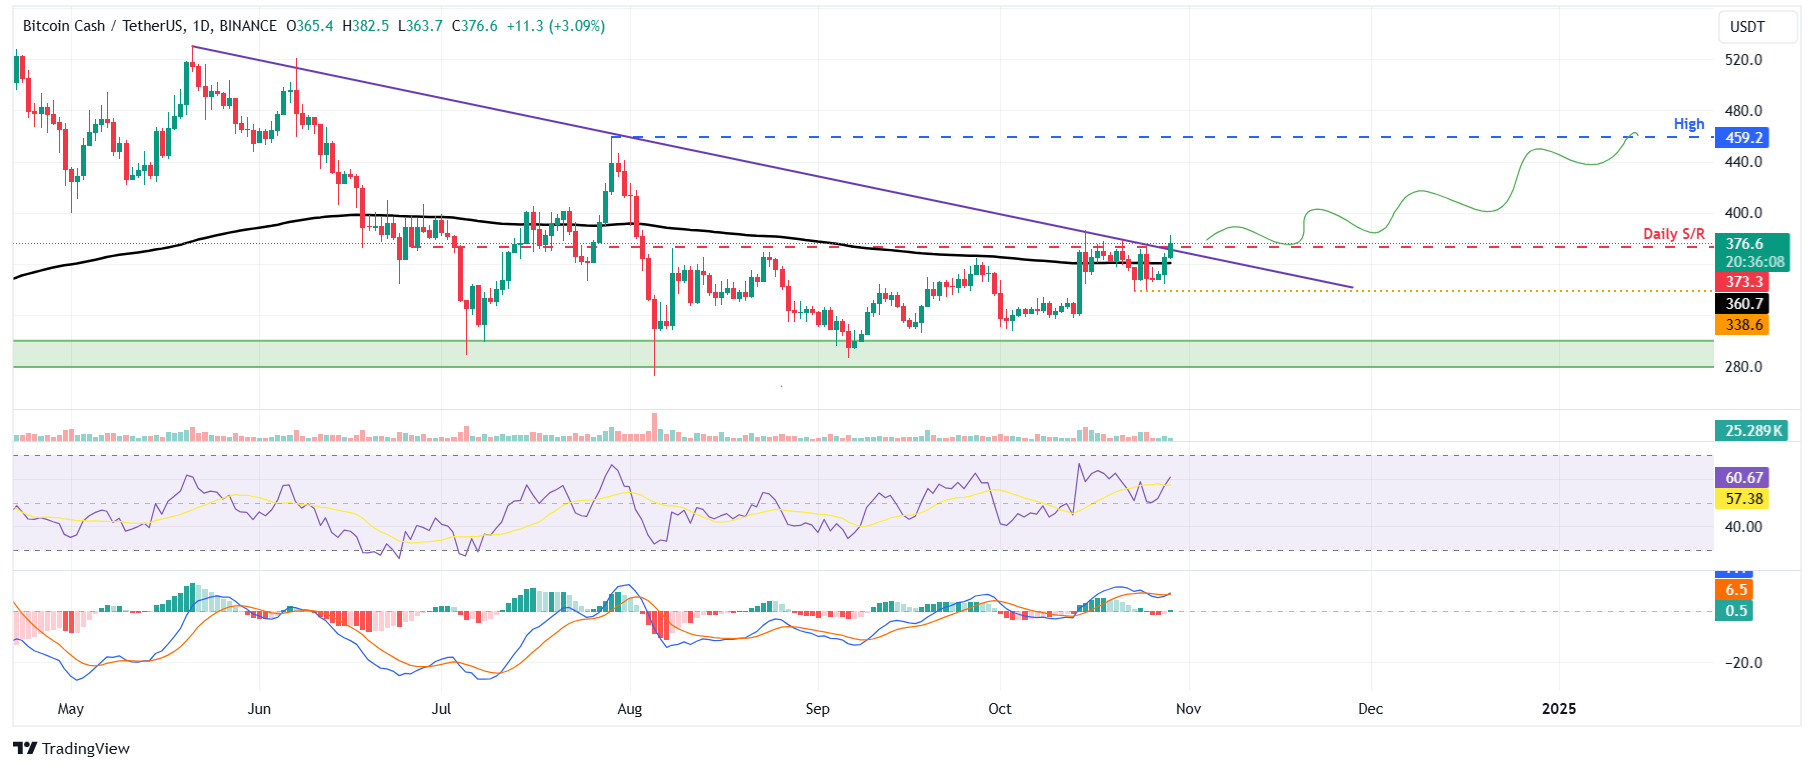
BCH/USDT daily chart
According to Coinglass’s OI-Weighted Funding Rate data, it is an important metric for traders and analysts to gauge market sentiment and predict future price movements. This index is based on the yields of futures contracts, which are weighted by their open interest rates. Generally, a positive rate (longs pay shorts) indicates bullish sentiment when long positions pay for shorts. Conversely, negative numbers (shorts pay longs) indicate bearishness, and shorts pay at the expense of longs.
In the case of Bitcoin Cash, this metric stands at 0.0103%, reflecting a positive rate and indicating that longs are paying shorts. This scenario often signifies a bullish sentiment in the market, suggesting potential upward pressure on Bitcoin Cash price.
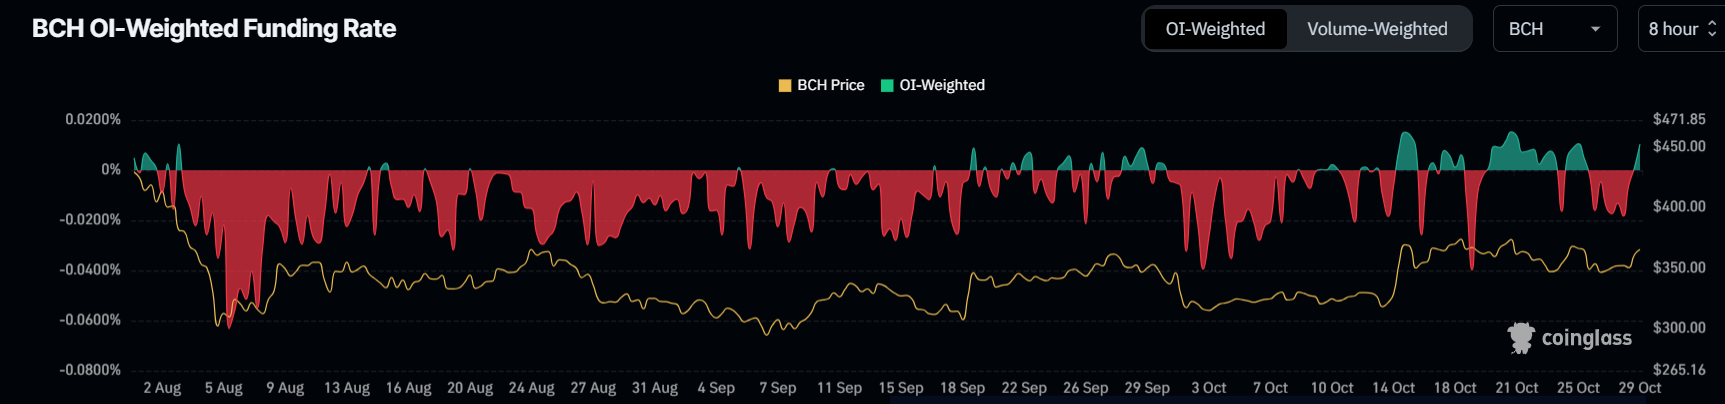
BCH OI-Weighted Funding Rate Chart. Source: Coinglass
According to Coinglass’s data, BCH’s long-to-short ratio also stands at 1.17, the highest level in one month. This ratio reflects bullish sentiment in the market, as the number above one suggests that more traders anticipate the price of Bitcoin Cash to rise.
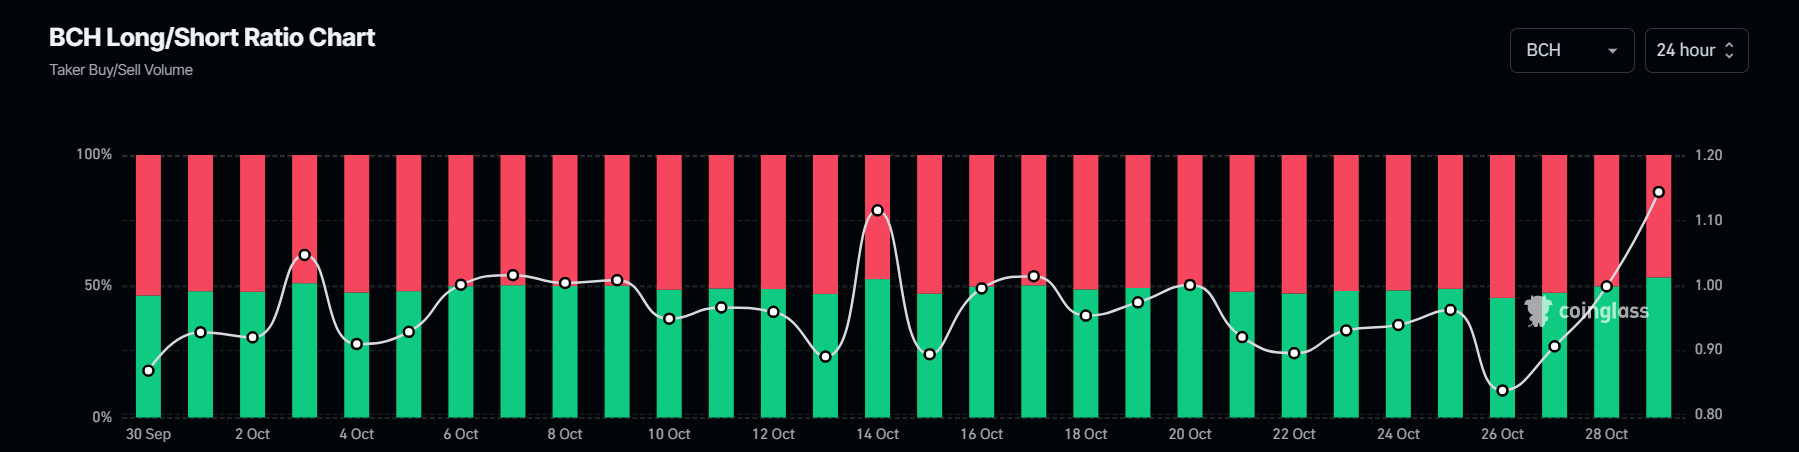
BCH long-to-short chart. Source: Coinglass
If BCH fails to break above the descending trendline and closes below $338.6, it would invalidate the bullish thesis by forming a lower low on the daily timeframe. This scenario would lead to a decline in Bitcoin Cash price to retest its next daily support at $299.7.
Author

Manish Chhetri
FXStreet
Manish Chhetri is a crypto specialist with over four years of experience in the cryptocurrency industry.


