Bitcoin Cash price analysis: BCH/USD bulls try to break above the downward trending line
- BCH/USD goes up from $278.65 to $279.75 in the early hours of Saturday.
- The price has re-entered the 20-day Bollinger band after dropping below it.

BCH/USD has had a bullish start to Saturday following four straight bearish days. BCH/USD has gone up from $278.65 to $279.75 in the early hours of Saturday. Over the last four days, Bitcoin Cash has gone down from $310.80 to $278.65. The hourly breakdown of the BCH/USD chart shows that the price fell to $273.20, found support and bounced up to $283. BCH/USD then fell to $279.25, where it found another support and corrected itself around $279.75.
BCH/USD daily chart
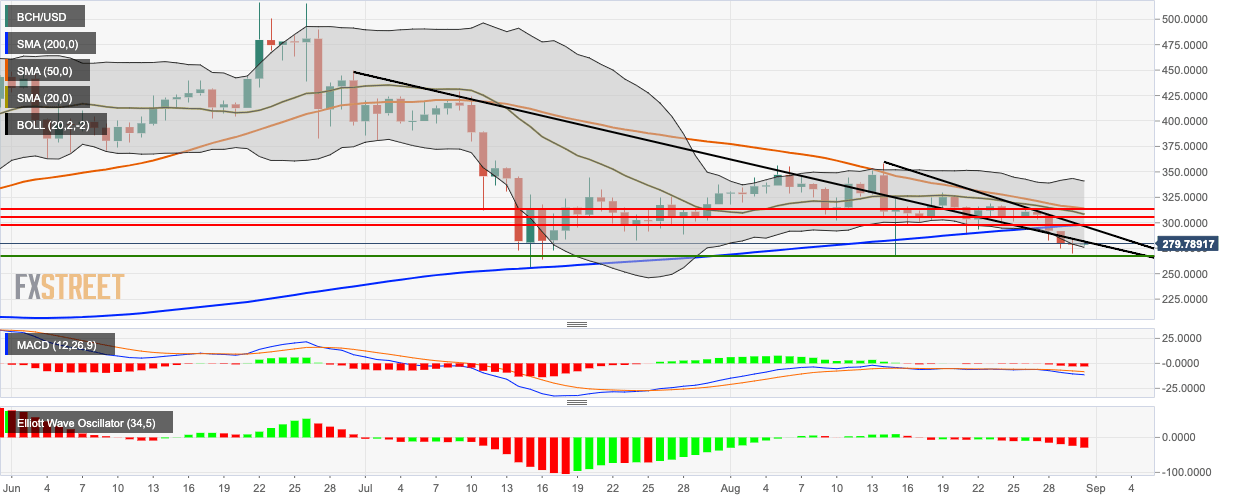
BCH/USD had briefly fallen below the 20-day Bollinger band this Thursday, indicating that it was underpriced, but has since re-entered the band. The Bollinger jaw has also widened, showing increasing market volatility. The price chart is trending below the 200-day simple moving average (SMA 200), SMA 50 and SMA 20 curves. The moving average convergence/divergence (MACD) and the Elliot oscillator both show increasing bearish momentum.
Author

Rajarshi Mitra
Independent Analyst
Rajarshi entered the blockchain space in 2016. He is a blockchain researcher who has worked for Blockgeeks and has done research work for several ICOs. He gets regularly invited to give talks on the blockchain technology and cryptocurrencies.


