|

Bitcoin Cash Price Analysis: BCH finally breaks above $231 resistance level

  • BCH has been previously trending in a $10-range between $221.20 to $231.
  • BCH must now get over strong resistance between $236.58 and $243.20

After trending in a narrow $10-range between $221.20 to $231, the bulls were finally able to push above the $231 resistance line. Currently, the buyers aim to take BCH/USD to $243.85 to break above the SMA 20 curve. The recent bullish price action has jumped the RSI from the edge of the oversold zone to 50. What this means is that there is more space for buyers to push the price up.

BCH/USD daily 

BCH/USD daily chart

BCH/USD IOMAP

fxsoriginal

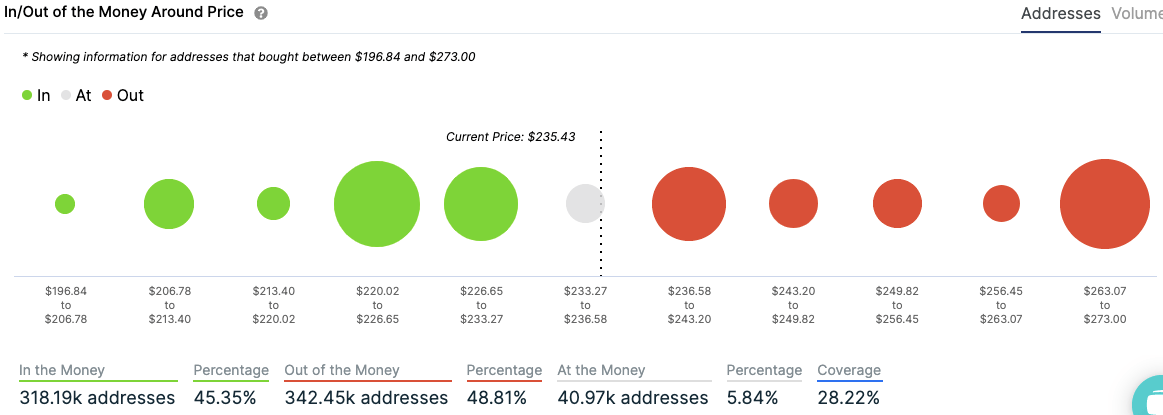
However, to enjoy any more bullish movement, BCH has to somehow get over strong resistance between $236.58 and $243.20. If they do manage to do that, then the price should be able to go up to $273, where it encounters the next strong resistance level.

On the flip side, if the price does fail to encounter the initial resistance, there is a moderate-to-strong support zone between $226.65 to $233.27.

Key levels

BCH/USD

Overview
Today last price238.6948
Today Daily Change12.7416
Today Daily Change %5.64
Today daily open225.9532
 
Trends
Daily SMA20244.8972
Daily SMA50274.7613
Daily SMA100254.6179
Daily SMA200248.8554
 
Levels
Previous Daily High228.8056
Previous Daily Low219.0434
Previous Weekly High233.272
Previous Weekly Low215.8975
Previous Monthly High338.2532
Previous Monthly Low244.1306
Daily Fibonacci 38.2%225.0765
Daily Fibonacci 61.8%222.7726
Daily Pivot Point S1220.3959
Daily Pivot Point S2214.8385
Daily Pivot Point S3210.6337
Daily Pivot Point R1230.1581
Daily Pivot Point R2234.3629
Daily Pivot Point R3239.9202


Author

Rajarshi Mitra

Rajarshi Mitra

Independent Analyst

Rajarshi entered the blockchain space in 2016. He is a blockchain researcher who has worked for Blockgeeks and has done research work for several ICOs. He gets regularly invited to give talks on the blockchain technology and cryptocurrencies.

More from Rajarshi Mitra
Share:

Editor's Picks

Crypto Today: Bitcoin, Ethereum, XRP extend decline, pressured by increasing ETF outflows

Cryptocurrencies are trading under pressure on Thursday, weighed down by risk-off sentiment driven by Middle East tensions and macroeconomic uncertainty. Bitcoin has extended its decline below $65,000 and is targeting the key support area at $60,000.

Bitcoin’s massive storm is back: Why the sell-off is far from over

Bitcoin price action over the last few weeks has felt less like a normal, healthy correction and more like a slow grinding crash that continues to wreak havoc on holdings and trading accounts. And everything suggests that the dramatic crash isn’t over.

Hyperliquid and Near Protocol fall sharply as Arthur Hayes dumps HYPE and NEAR for Worldcoin

Hyperliquid (HYPE) and Near Protocol (NEAR) prices have dropped 11% and 17%, respectively, at press time on Thursday, erasing gains as the well-known investor Arthur Hayes dumps HYPE and NEAR holdings.

Pi Network hits record low as market-wide risk-off sentiment weighs

PI price hovers around $0.1300 at press time on Thursday, reflecting a mild rebound from the $0.1186 record low reached earlier on the day. Deposits totaling roughly 1 million PI tokens on exchanges over the last 24 hours suggest waning investor confidence amid a broader market risk-off sentiment.

Billions in ETF outflows don’t bode well
Bitcoin (BTC) remains under pressure, trading below $74,000 on Friday, and is set to post its third consecutive week of losses. The institutional sell-off continues, with spot BTC Exchange-Traded funds (ETFs) recording billions in outflows. In addition, sticky inflation and macroeconomic headwinds suppress the Crypto King’s upside potential. Institutional demand continues to weaken so far this week.