Bitcoin cash is bouncing after a thrust out of a triangle

How Elliott Wave helped us to navigate the "Drop and Pop" Movement on BCHUSD?!
Bitcoin Cash with ticker BCHUSD is trading south for the last couple of months, but we want to focus on the intraday hourly chart in which we have spotted nice and clean pattern by Elliott wave theory.
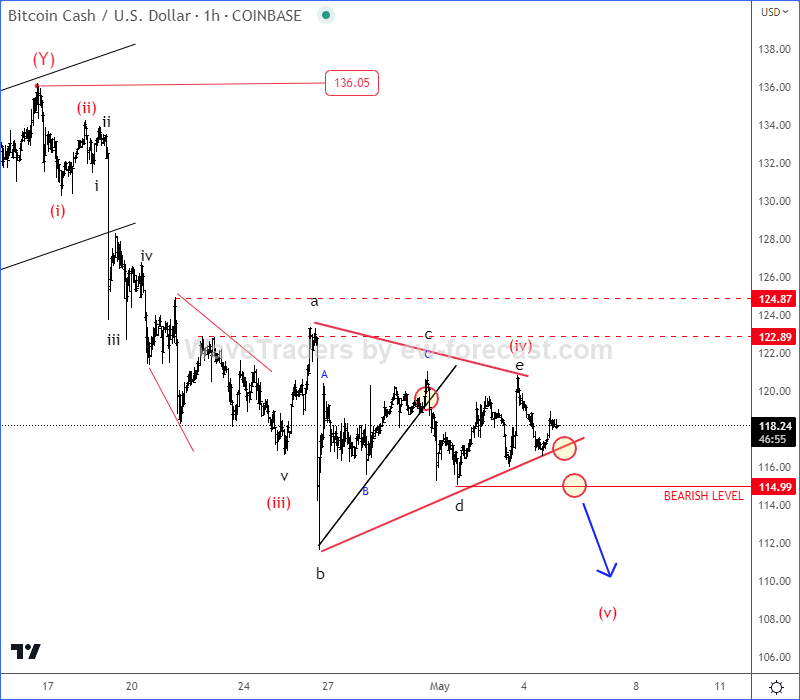
At the end of April and beginning of May we were tracking a bearish running triangle formation within wave (iv) that was indicating for the final wave (v) before bounce and recovery. Triangle consists of five waves a-b-c-d-e and it’s a continuation pattern that usually occurs in 4th waves of an impulse and in B-waves of correction.
BCH/USD 1h chart from May 05
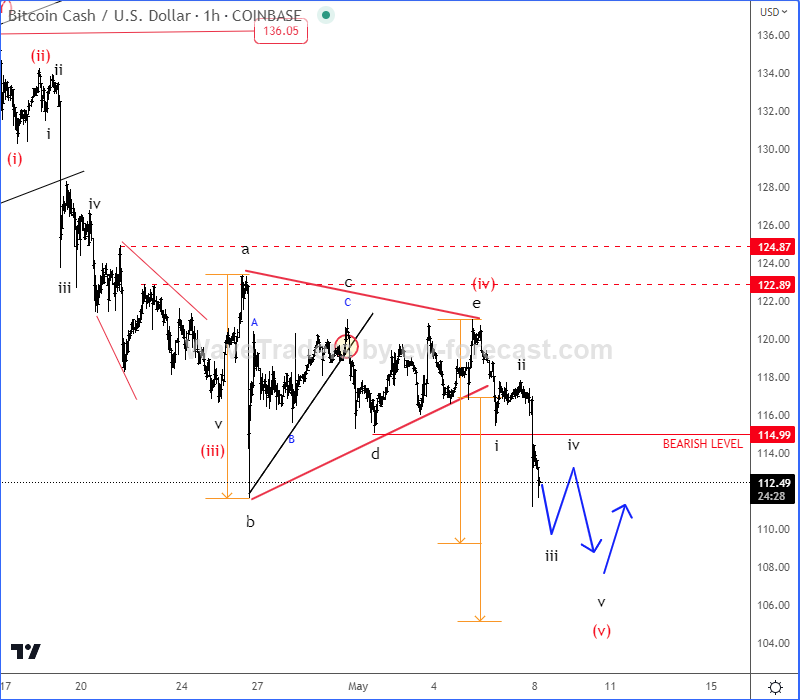
As you can see, after completing of a triangle within wave (iv), BCHUSD dropped yesterday on May 08 into final wave (v) towards projected target, from where we expected a rebound once a five-wave cycle of the lower degree fully unfolds.
BCH/USD 1h chart from May 08
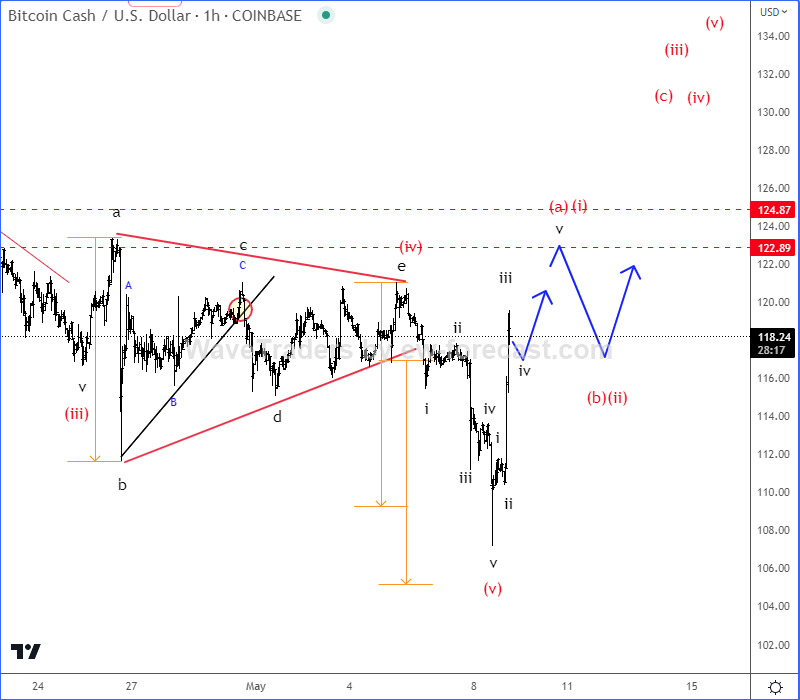
And, today on May 09 we can see nice and sharp bounce, which suggests now at least a temporary support in place. Currently it seems to be unfolding a five-wave bullish impulse into first leg (a)/(i), so more gains can be seen for wave (c) or (iii) in upcoming days/weeks, just watch out for an intraday pullback in (b)/(ii).
BCH/USD 1h chart from May 09
Get Full Access To Our Premium Elliott Wave Analysis For 14 Days. Click here.
Get Full Access To Our Premium Elliott Wave Analysis For 14 Days. Click here.
Author

Gregor Horvat
Wavetraders
Experience Grega is based in Slovenia and has been in the Forex market since 2003.


