Bitcoin holds steady above $63,000 as signs of whale accumulation and ETF inflows
- Bitcoin price consolidates between $62,000 and $64,700 key levels, indicating a period of indecision among traders.
- Arkham intelligence data reveals that dormant wallets are beginning to move, while Lookonchain data indicates a significant accumulation by whales.
- US Spot ETFs record an inflow of $136.70 million on Tuesday.

Bitcoin (BTC) trades slightly down around $63,800 at the time of writing on Wednesday, consolidating within the $62,000 and $64,700 key levels for the sixth day in a row. There are signs of indecision among traders as dormant wallets begin to move, some whales accumulated, and the US Spot Exchange Traded Fund (ETF) recorded more than $136 million inflow on Tuesday.
Bitcoin dormant whales are active
Akham intelligence data shows dormant wallets are on the move. A 13-year-old whale wallet, which had remained inactive since mid-2011, transferred 20 BTC valued at $1.27 million to the Bitstamp exchange on Tuesday, marking its first movement since the coins were initially received. During the same period, another whale wallet holding $77 million worth of BTC also move 5 BTC to Kraken. This wallet still holds 1215 BTC worth $77 million and has been mining since 2009, one month after the Bitcoin launch. This whale woke up around three weeks ago and has moved 10 Bitcoins to Kraken in 3 separate transactions.
The third early Bitcoin whale, which mined Bitcoin around the same time, was active last week. After 15 years of dormancy, it woke up to move $16 million of BTC.
This movement by early dormant wallets could spark Fear, Uncertainty, and Doubt (FUD) among the traders, as the wallets are generally moving BTC into centralized exchanges that are likely to sell. Investors must be cautious about such activity.
ANOTHER ANCIENT BITCOIN WHALE MOVES $3M BTC
— Arkham (@ArkhamIntel) September 24, 2024
A 13 year old whale with $3.17M BTC from mid-2011 woke up today.
This wallet has not made a single move since receiving the coins 13 years ago.
They have just transferred 20 BTC ($1.27M) to Bitstamp. https://t.co/hQe43GgYtm pic.twitter.com/HnvbZbgDHK
Lookonchain data shows that two whales accumulated $219 million worth of BTC on Tuesday. The first whale accumulated $154.43 million in BTC, while the second whale accumulated 1,015 BTC worth $64.47 million. Whale accumulations like these are generally considered a positive sign and show investors confidence in Bitcoin.
Whales are accumulating $BTC!
— Lookonchain (@lookonchain) September 24, 2024
2 whales have withdrawn 3,463 $BTC($219M) from #Binance in the past 12 hours!
Address:
bc1q57rcscs6ztj0xnslwkt4nervxkpen07h9h2jnr2hkwlg3lwuljrsdwt2m2
12993NM9fV8dSSQgbWDZSBVgqtPw4DaAXS pic.twitter.com/Ux4YXKrZ20
Moreover, institutional flows rose on Tuesday. According to Coinglass’s data, the US spot Bitcoin ETF experienced an inflow of $136.70 million on Tuesday. This is a positive sign for Bitcoin, as such inflows suggest that institutional investors are actively accumulating the cryptocurrency.
Additionally, the total Bitcoin reserves held by the 11 US spot Bitcoin ETFs, Asset Under Management (AUM), have reached $51.04 billion, the highest level since July 30.
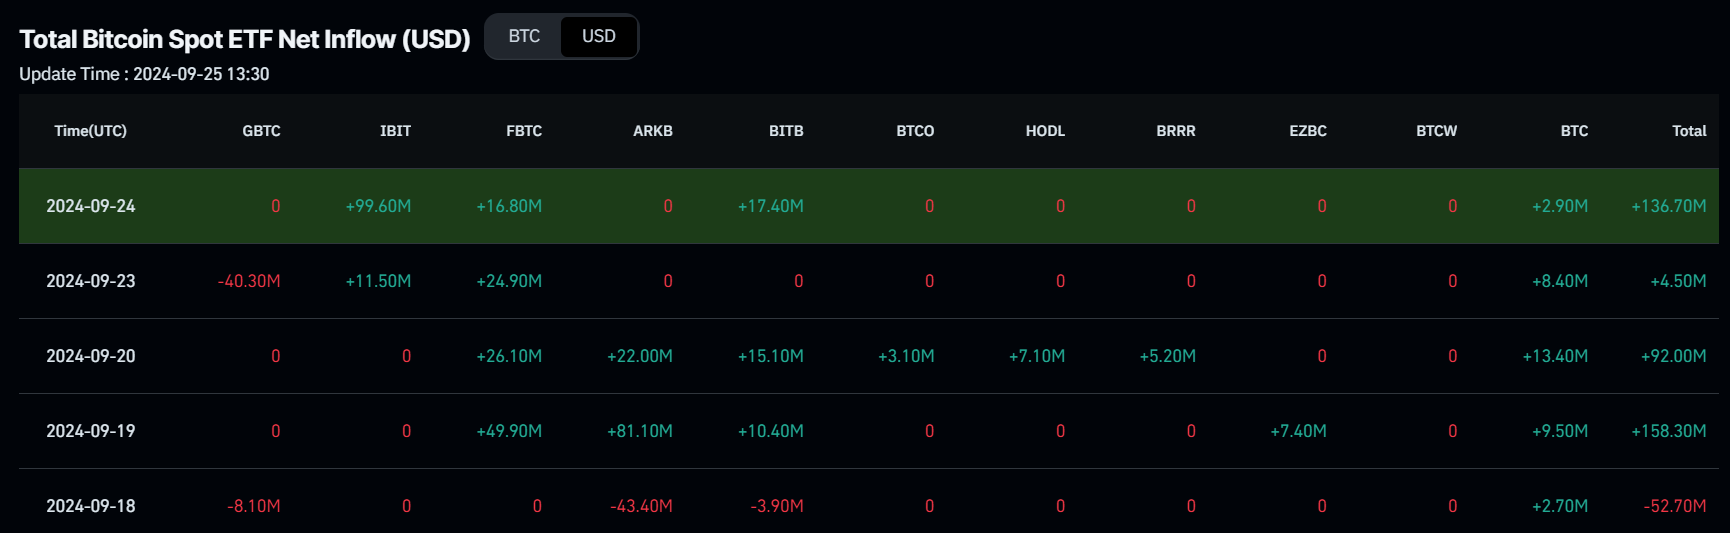
Bitcoin Spot ETF Net Inflow chart
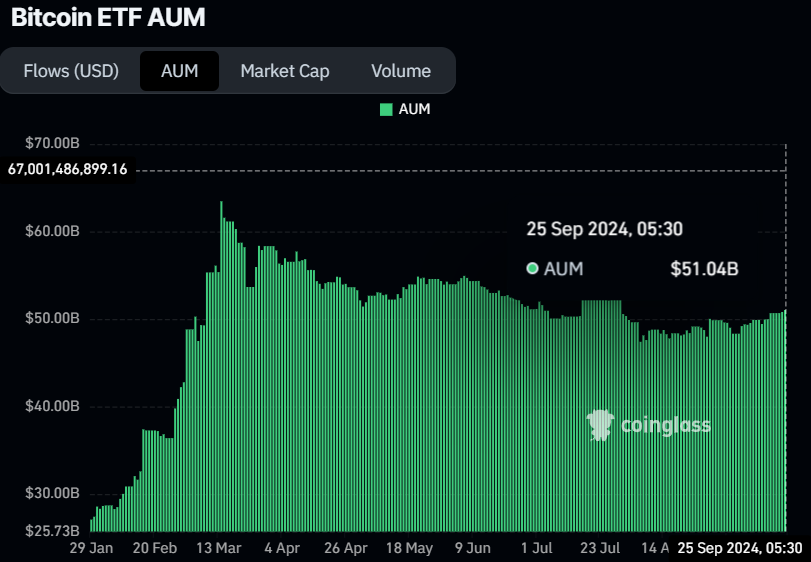
Bitcoin ETF AUM
Santiment’s Exchange Flow balance metric also shows a positive sign for Bitcoin. This metric shows the net movement of Bitcoin into and out of exchange wallets. A rise in this metric indicates more BTC has entered the exchanges than exited, hinting at selling pressure from investors. Conversely, a fall in the metric indicates that more BTC left the exchange than entered, indicating less selling pressure from investors.
As in Bitcoin’s case, the metric fell from 2,099 BTC on Monday to -7,510 BTC on Tuesday. This fall indicates increasing confidence among investors as holders remove BTC tokens from exchanges and store them in cold wallets.
%20[13.42.21,%2025%20Sep,%202024]-638628613240721902.png)
Bitcoin Exchange Flow balance chart
Bitcoin bulls set sights on $70,000 amid ongoing consolidation
Bitcoin's price has been consolidating between the $62,000 and $64,700 key levels for over six days after rallying 7.5% last week. As of Wednesday, it trades slightly down at $63,854 after retesting its upper consolidation level of $64,700.
If Bitcoin’s price breaks above this consolidating range around $64,700, it could first rise to retest its daily resistance level at $65,379. A successful daily close above this level could extend the rally by 7% to retest its July 29 high of $70,079.
The Relative Strength Index (RSI) on the daily chart points downwards, trading at 62, reflecting the decrease in bullish momentum. For Bitcoin to break above the consolidating zone, the RSI must rise and head towards its 70 level. However, traders should be cautious if it exceeds the overbought level 70.
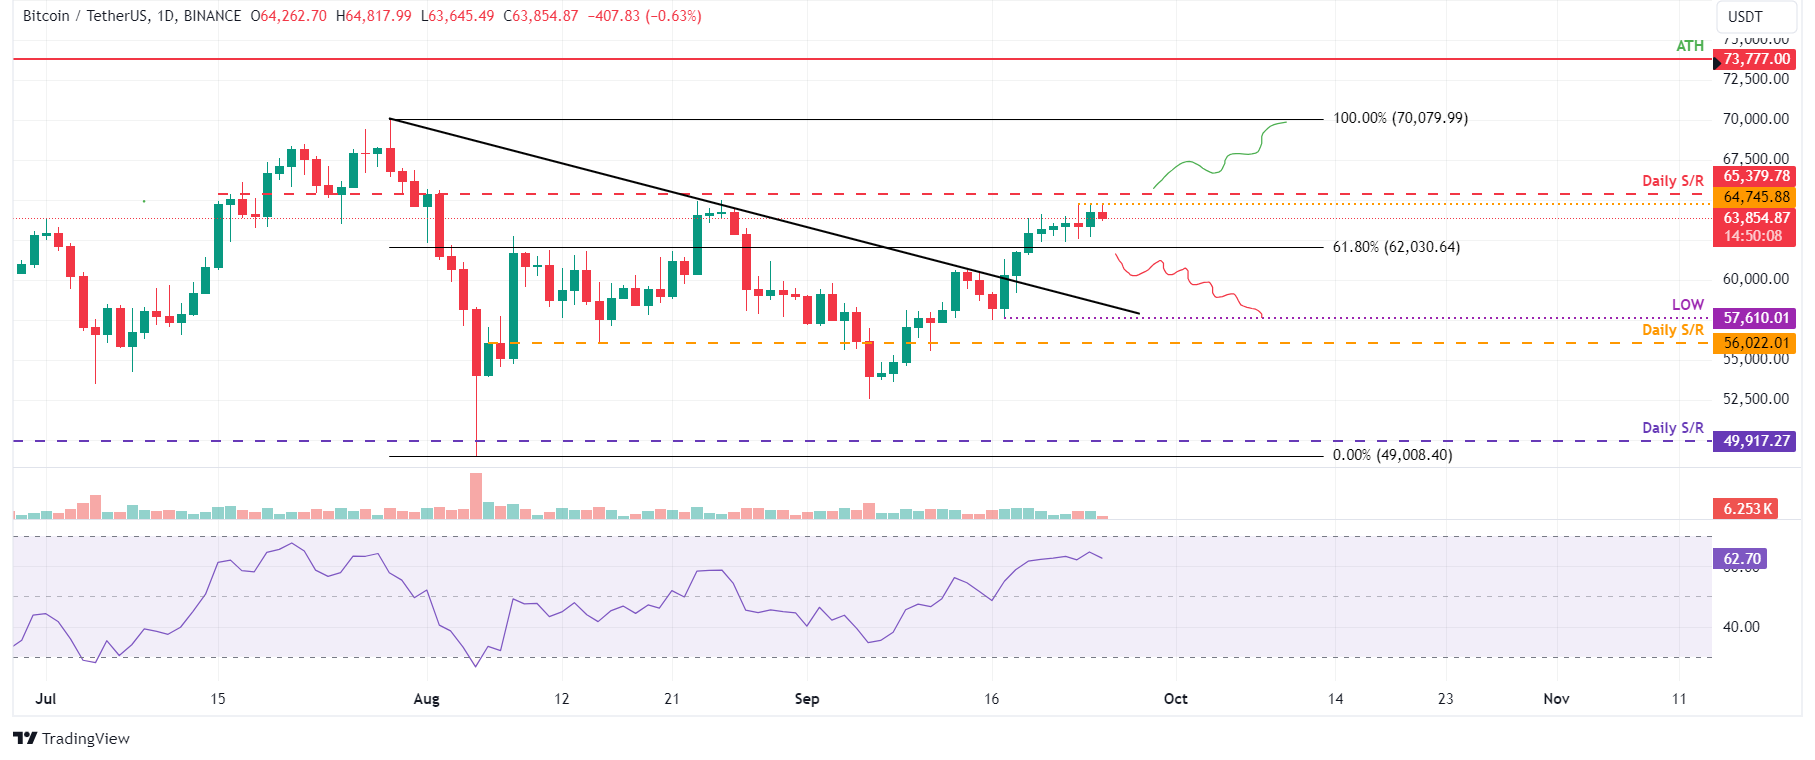
BTC/USDT daily chart
However, if BTC breaks and closes below the consolidation zone around $62,000, it could decline 7% to retest its September 17 low of $57,610.
Bitcoin, altcoins, stablecoins FAQs
Bitcoin is the largest cryptocurrency by market capitalization, a virtual currency designed to serve as money. This form of payment cannot be controlled by any one person, group, or entity, which eliminates the need for third-party participation during financial transactions.
Altcoins are any cryptocurrency apart from Bitcoin, but some also regard Ethereum as a non-altcoin because it is from these two cryptocurrencies that forking happens. If this is true, then Litecoin is the first altcoin, forked from the Bitcoin protocol and, therefore, an “improved” version of it.
Stablecoins are cryptocurrencies designed to have a stable price, with their value backed by a reserve of the asset it represents. To achieve this, the value of any one stablecoin is pegged to a commodity or financial instrument, such as the US Dollar (USD), with its supply regulated by an algorithm or demand. The main goal of stablecoins is to provide an on/off-ramp for investors willing to trade and invest in cryptocurrencies. Stablecoins also allow investors to store value since cryptocurrencies, in general, are subject to volatility.
Bitcoin dominance is the ratio of Bitcoin's market capitalization to the total market capitalization of all cryptocurrencies combined. It provides a clear picture of Bitcoin’s interest among investors. A high BTC dominance typically happens before and during a bull run, in which investors resort to investing in relatively stable and high market capitalization cryptocurrency like Bitcoin. A drop in BTC dominance usually means that investors are moving their capital and/or profits to altcoins in a quest for higher returns, which usually triggers an explosion of altcoin rallies.
Author

Manish Chhetri
FXStreet
Manish Chhetri is a crypto specialist with over four years of experience in the cryptocurrency industry.