Bitcoin and Ethereum price rise halting makes way for layer-2 & DeFi tokens to chart over 40% gains
- Ethereum price, along with Bitcoin, is presently moving sideways after hitting $1,857 and $35,000 respectively.
- Small-cap cryptocurrencies are making gains fuelled by high investor participation.
- The total value of all other cryptocurrencies, excluding BTC and ETH, has risen by 14% but needs another 9.3% increase to recover all the recent losses.

Bitcoin and Ethereum price initiated the bullish momentum that pulled up the entire cryptocurrency market. However, even as their rally comes to a halt, the rest of the altcoins seem to continue making the most of the situation, resulting in a significant rise over the past couple of days.
Bitcoin and Ethereum price halt
Bitcoin, after hitting $35,000, stepped back for a while, and Ethereum price did the same after reaching $1,857. Both the cryptocurrencies for the past few days have been moving sideways as the market cools down, but there is an inkling that this sideways price action could result in a decline.
In the case of Ethereum, the Moving Average Convergence Divergence (MACD) indicator contributes to this forecast as the receding green bars on the histogram suggest the bullishness is waning. If this is followed by the signal line (orange) moving over the MACD line (blue), a bearish crossover would be confirmed.
This would occur only if Ethereum price loses the support of $1,827, which coincides with the crucial 61.8% Fibonacci Retracement from $2,005 to $1,539. The ensuing bearish momentum would not only confirm a bearish crossover but also bring ETH down to 50% Fibonacci line at $1,772.
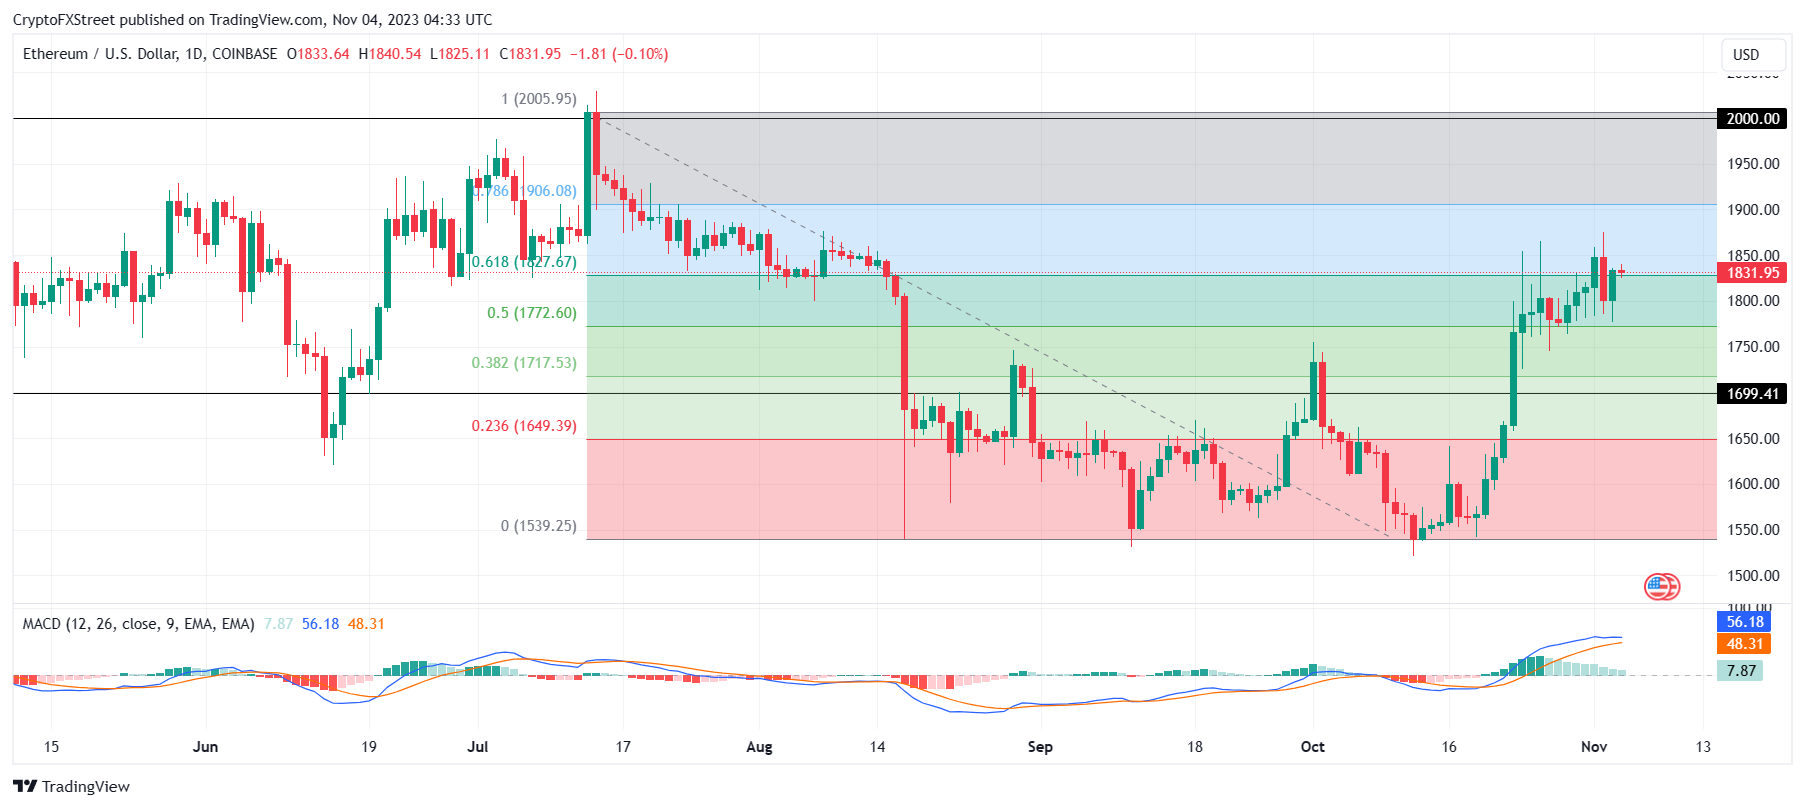
ETH/USD 1-day chart
However, if the sideways momentum meets bullish momentum via broader market cues and the $1,827 line is tested as a support floor, a recovery is on the cards. Breaching the 78.6% Fib retracement at $1,906 would not only invalidate the bearish thesis but also flip $1,900 into support.
Other cryptocurrencies are faring rather well
While BTC and ETH are seeing waning bullishness, the past few days have been spectacular for altcoin investors. Many layer-2 cryptocurrencies, as well as Decentralized Finance (DeFi) tokens, have seen significant rises along with the majority of the layer-1 tokens.
Analytics platform IntoTheBlock, in regards to this shift in capital, stated,
"This week's trend suggests this rotation is beginning to take place as Bitcoin and Ether trend sideways while DeFi and alternative L1 tokens record a strong rebound.
This was verified by the fact that SushiSwap noted a 63% rise in the past three days. Other top DeFi tokens like THORChain (RUNE), PancakeSwap (CAKE), and Aave (AAVE) noted about 35%, 31%, and 15%, respectively.
This resulted in the market capitalization of altcoins, excluding Bitcoin and Ethereum, observing a 14.67% growth, adding 47.13 billion since mid-October. This has brought the market cap to $368 billion, but for the recent losses to be recovered, altcoins would need to collectively raise the market capitalization by 9.38% and register inflows worth $34.55 billion to bring it to a 2023 high of $402.5 billion.
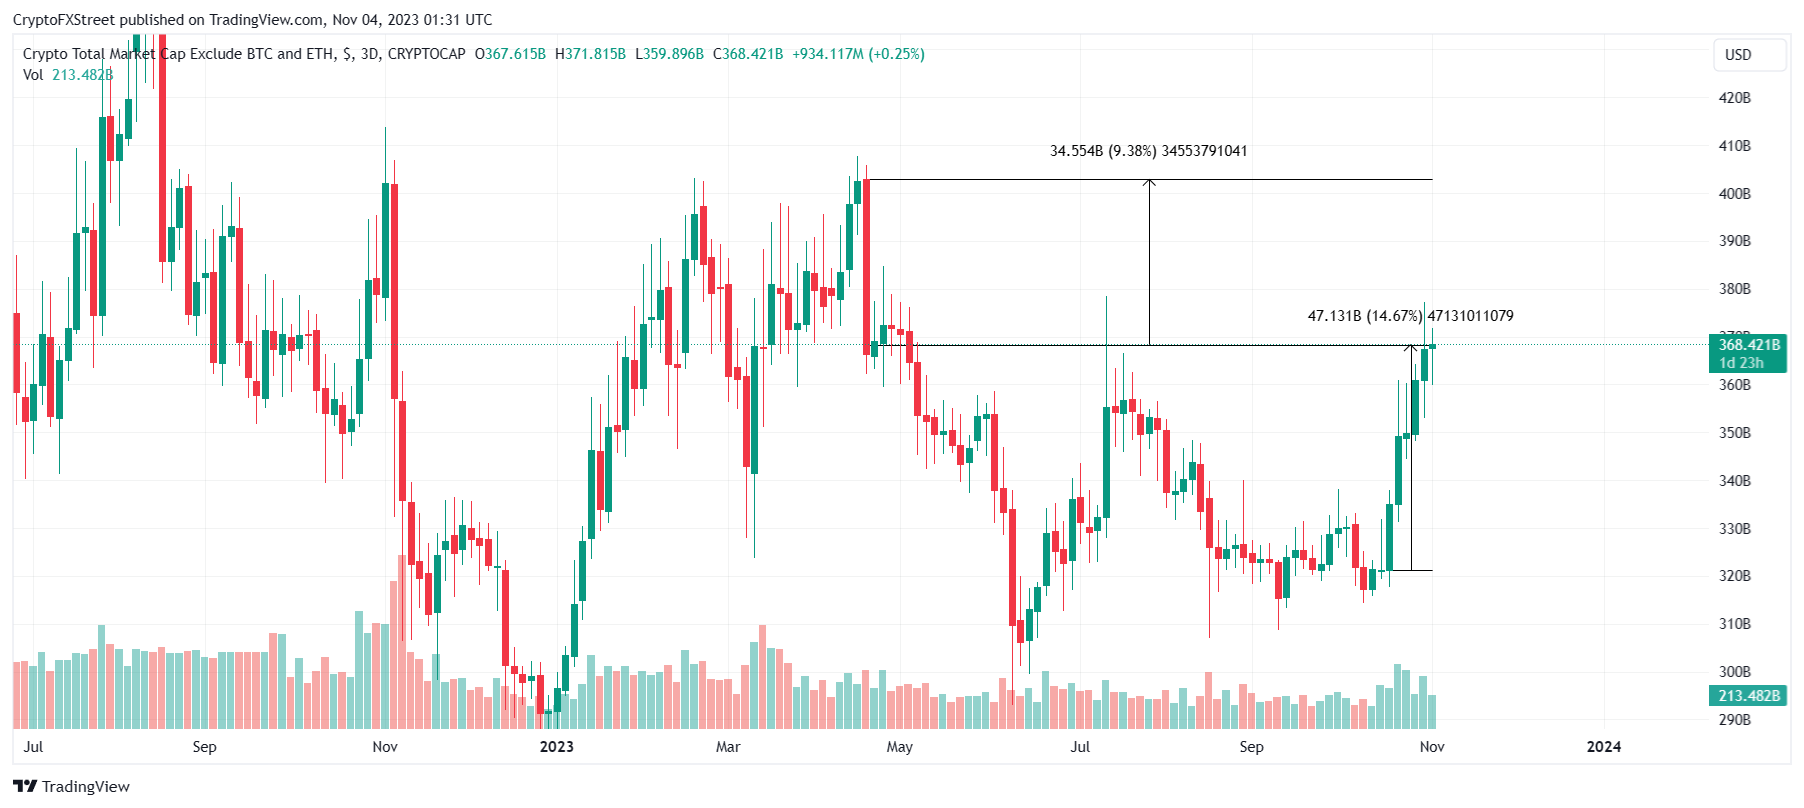
Altcoin market capitalization
Historically, crypto cycles have followed a pattern of Bitcoin leading the first surge, followed by Ethereum rising, and eventually, capital progressively being allocated to lower-cap and riskier bets. However, if the broader market cues turn bearish, these altcoins could also note sideways movement.
Read more - SushiSwap price rallying by 63% in four days causes $4.8 million worth of short liquidations
Author

Aaryamann Shrivastava
FXStreet
Aaryamann Shrivastava is a Cryptocurrency journalist and market analyst with over 1,000 articles under his name. Graduated with an Honours in Journalism, he has been part of the crypto industry for more than a year now.


