Bitcoin, Ethereum, Ripple & Litecoin: short-term technical analysis
- Charts point to a bullish move after achieving the retreat goals.
- Close resistances will test the new movement strength.

Generalized consolidations in the main cryptos during yesterday's sessions. The prices successfully tested averages and supports and the bullish reaction is widespread. In all cases, there are several resistances blocking the rising way.
Yesterday, Goldman Sachs - through its partner Circle – bought Poloniex, a Boston-based negotiation platform, in an operation that some sources value at $400M.
BTC/USD 240 min
Bitcoin's minimum in yesterday's retreat was $7,814.42, and that's now the level to keep an eye on. In the 240 min. chart, it drew a doji candle at that level is rising ever since, having broken the first resistance, it now moves at $8,115 and heads to $82,87, the next resistance it already surpassed a few days ago. Farther, at $8,610 stands the next price barrier.
Below, besides yesterday's minimum, the 50-EMA supports the price at $7,784, and the 200-SMA at $7,698.

The MACD has reached the equilibrium zone and is ready for a cross to the upside. Still, there's a slight chance of a MACD failure pattern that would send the price to lower regions before the eventual trend.
In the Directional Movement Index, buyers overtake sellers, but they're still very close to each other. The D+ moves above the ADX, and the latter coming with the D+ in the rising move would definitely confirm the bullish trend.
ETH/USD 240 min
Ethereum tested a support created by a long-term trendline and moves between $500 and $525, where the first resistance lays. Should it break it, it would find no obstacles until $575. Above, there's a main resistance at $625.
Below, the main support is at $486, where the aforementioned trendline, the 50-EMA and a price support converge. Further down, there are the 200-SMA at $466 and another long-term trendline at $440.

The 240 min MACD is similar to Bitcoin's, suggesting a bullish trend but with chances of a previous testing bearish move.
The Directional Movement Index is similar to Bitcoin's, with buyers in control and above the ADX.
XRP/USD 240 min
Ripple is constrained by a wedge, close to the roof. It has drawn a doji in its first test and could now go back to a support at $0.667. The next support is the wedge's baseline at $0.6468. A walk below that level could be potentially dangerous, since the averages are somewhat far.
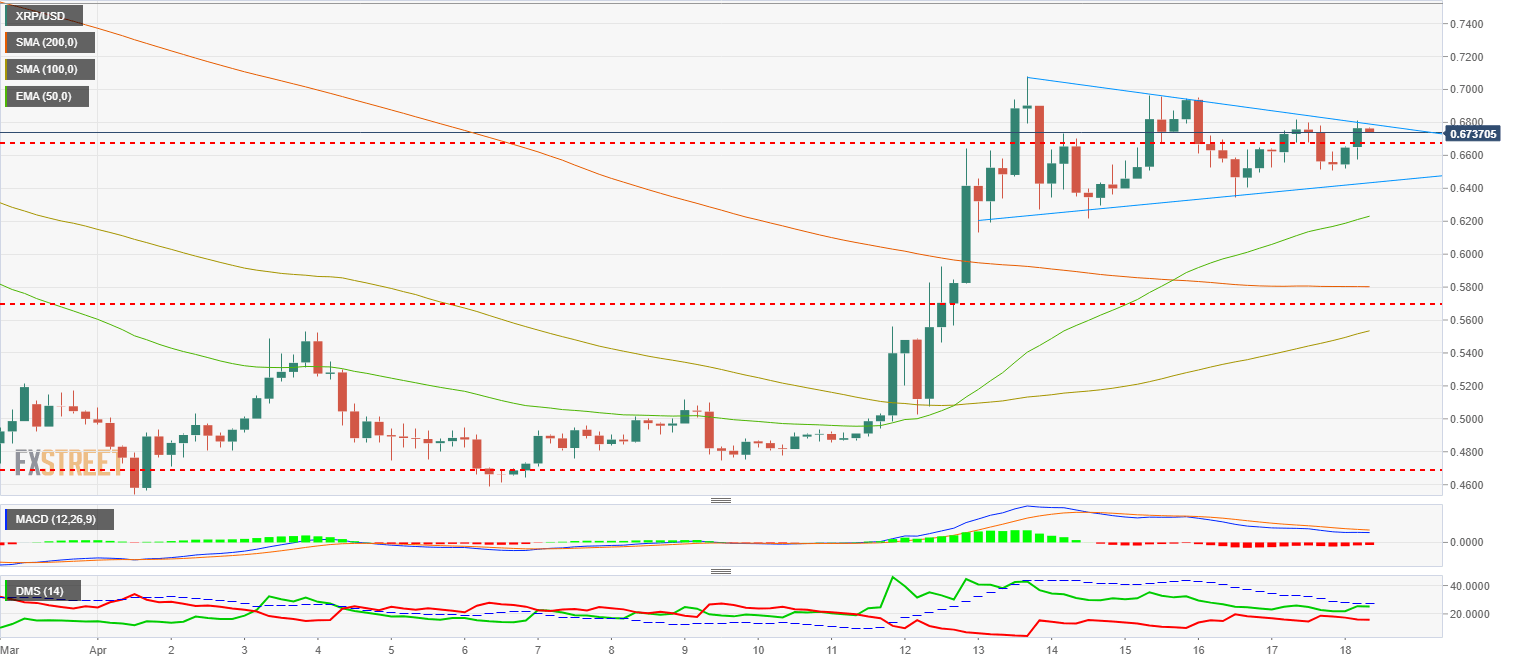
The MACD is now behind the other cryptos. It lacks the slope needed for a bullish run and it still needs time to be ready for it.
The Directional Movement Index shows purchasers in control, although the D+ doesn't reach the ADX, weakening any bullish move.
LTC/USD 240 min
Litecoin moves in a narrow range between the 200-SMA at $135 and a long-term price resistance at $139. Trading above the 200-SMA always conveys bullish messages, so that's the key level to watch. Above, free way until $158, then another main resistance at $175 that should be broken to confirm a mid-term bullish trend.
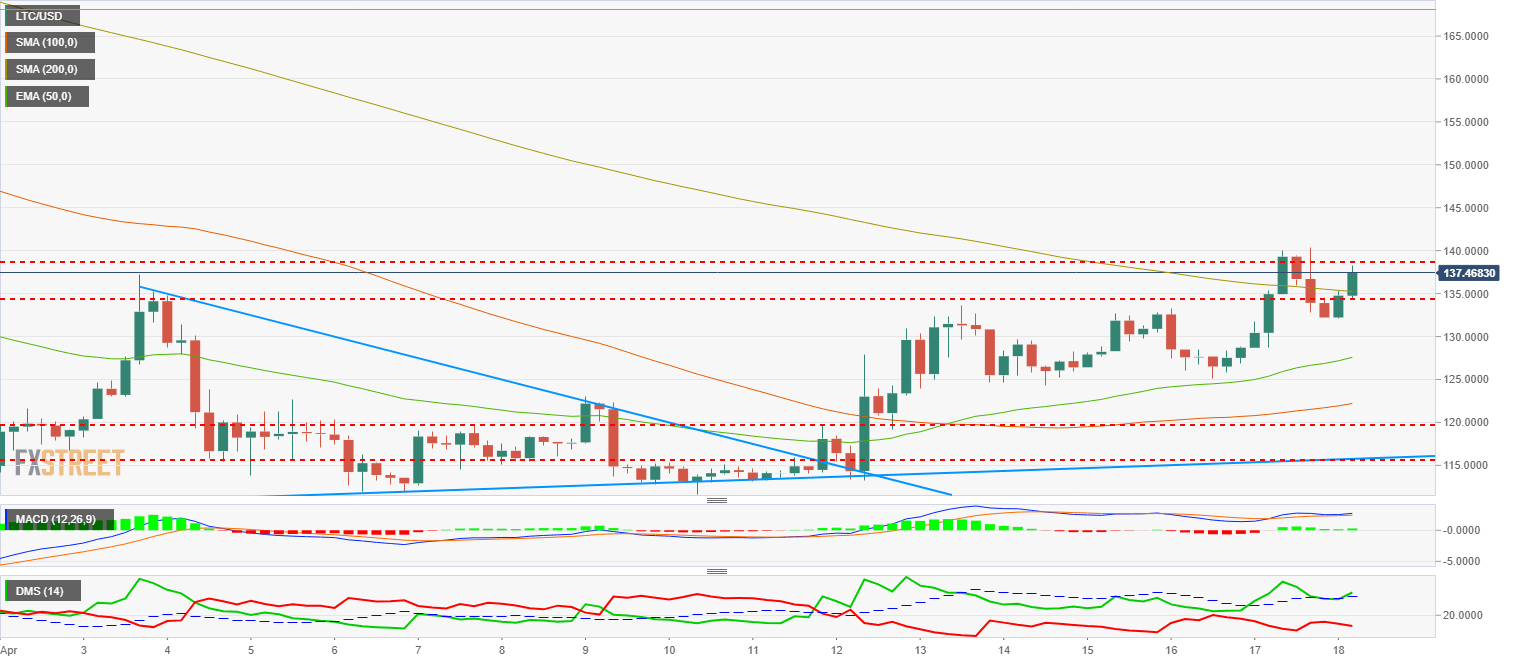
The MACD is quite different to the rest, with the average above the signal and having achieved the bullish and bearish testing patterns, favoring a risign setting.
In the Directional Movement Index, buyers have a clear advantage with respect to sellers. The D+ moves above a rising ADX and they move with the price.
Author

Tomas Salles
FXStreet
Tomàs Sallés was born in Barcelona in 1972, he is a certified technical analyst after having completing specialized courses in Spain and Switzerland.


