Avalanche price set for surge as Franklin Templeton extends its L1 blockchain footprint to Avalanche
- Franklin Templeton, a global investment firm, expands its L1 blockchain focus to include Avalanche.
- Agora launches its fully-collateralized US digital dollar, AUSD, on the Avalanche network.
- Avalanche price trades inside a falling wedge pattern; breakout would signal a bullish move ahead.
- On-chain data paints a bullish picture, with AVAX's TVL rising and the long-to-short ratio above one.
- A daily candlestick close below $19.73 would invalidate the bullish thesis.

Avalanche (AVAX) trades inside a falling wedge pattern on Thursday, and a breakout would signal a bullish trend. As of Thursday, AVAX had gained 4%. The recent launch of investment firm Franklin Templeton’s and Agora's fully-collateralized US digital dollar, AUSD, on the Avalanche network suggests that the AVAX price will rally in the coming days.
Franklin Templeton and Agora launch their project on the Avalanche network
Franklin Templeton, a leading global investment firm with $1.6 trillion in assets under management, has expanded its blockchain footprint by introducing its pioneering on-chain money market fund, the Franklin Templeton OnChain U.S. Government Money Fund (FOBXX), to the Avalanche network. This marks the first US-registered mutual fund to utilize a public blockchain for transaction processing and share ownership, underscoring Avalanche's growing institutional infrastructure and its role in shaping the future of finance.
Global investment firm with $1.6T AUM expands its L1 blockchain footprint to Avalanche.
— Avalanche (@avax) August 22, 2024
The Franklin Templeton OnChain U.S. Government Money Fund (FOBXX) is the first and only U.S.-registered mutual fund to leverage a public blockchain as the system of record to process… pic.twitter.com/p9l8Whg88Y
Additionally, Agora has launched its fully collateralized US digital dollar, AUSD, on the Avalanche network, embodying the principle of monetary neutrality with an open model that encourages various businesses — from exchanges to fintech — to engage with and benefit from the network's growth. Leveraging Avalanche's EVM compatibility, sub-second transaction finality, low fees, and customizable infrastructure, AUSD could draw increased users and liquidity to the Avalanche platform.
Introducing AUSD to Avalanche
— Agora (@withAUSD) August 20, 2024
We're thrilled to announce that you can now transact, trade, and pay @withAUSD on @avax.
AUSD is live on @TraderJoe_xyz with significant liquidity and will be coming to more apps like @BenqiFinance, @Trensi_fi, @PharaohExchange, and more. https://t.co/w86qh4OiS0
Avalanche price shows potential for a rally ahead
Avalanche price trades inside a falling wedge pattern, formed by joining multiple high and low levels with trendlines from mid-March. The breakout of this pattern generally signals a bullish move. When writing, it is trading higher by 4% at $24.49 on Thursday.
If AVAX breaks and closes above the falling wedge pattern, it could rally 33% to retest its 61.8% Fibonacci retracement level at $32.45, drawn from the high on May 22 to the low on August 5.
The Relative Strength Index (RSI) on the daily chart trades above its neutral level of 50, and the Awesome Oscillator (AO) is on its way to trading above its neutral level of zero. If bulls are indeed returning, then both momentum indicators must maintain their positions above their respective neutral levels. Such a development would add a tailwind to the ongoing rally.
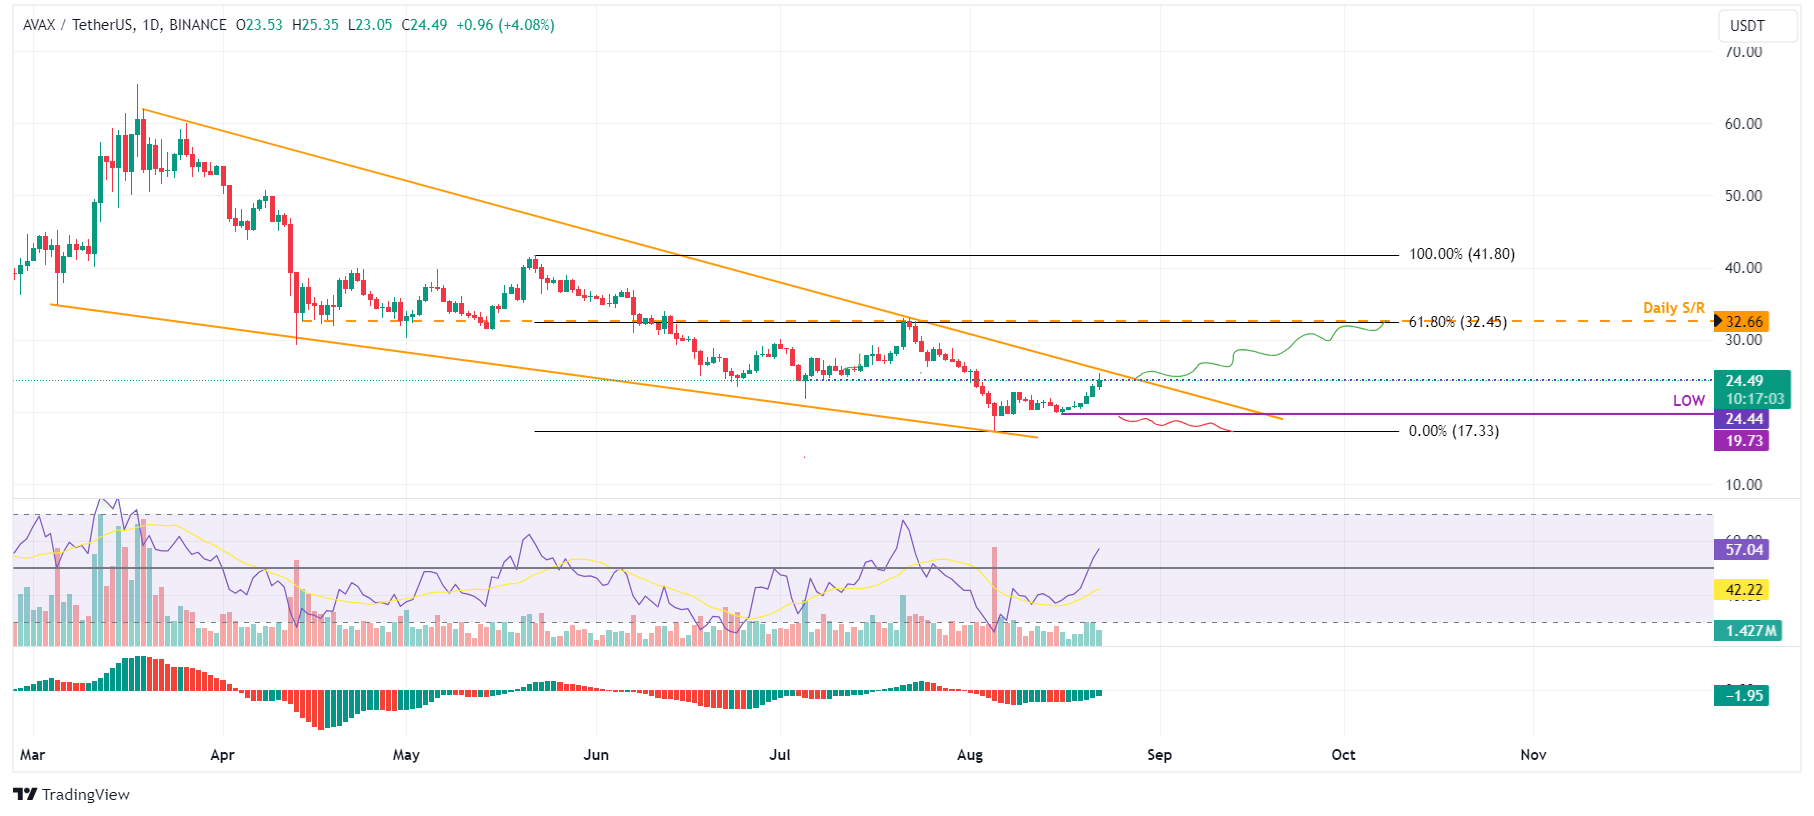
AVAX/USDT daily chart
Crypto intelligence tracker Artemis data shows that Avalanche's TVL increased from $832.3 million on Monday to $891.1 million on Thursday, constantly rising since August 5.
This 7% increase in TVL indicates growing activity and interest within the Avalanche ecosystem. It suggests that more users deposit or utilize assets within AVAX-based protocols, adding credence to the bullish outlook.
-638599346328937318.jpg)
AVAX TVL chart
According to Coinglass's data, AVAX's Binance long-to-short ratio is 1.66. This ratio reflects bullish sentiment in the market, as the number above one suggests that more trades anticipate the price of the asset rising, bolstering Avalanche's bullish outlook.
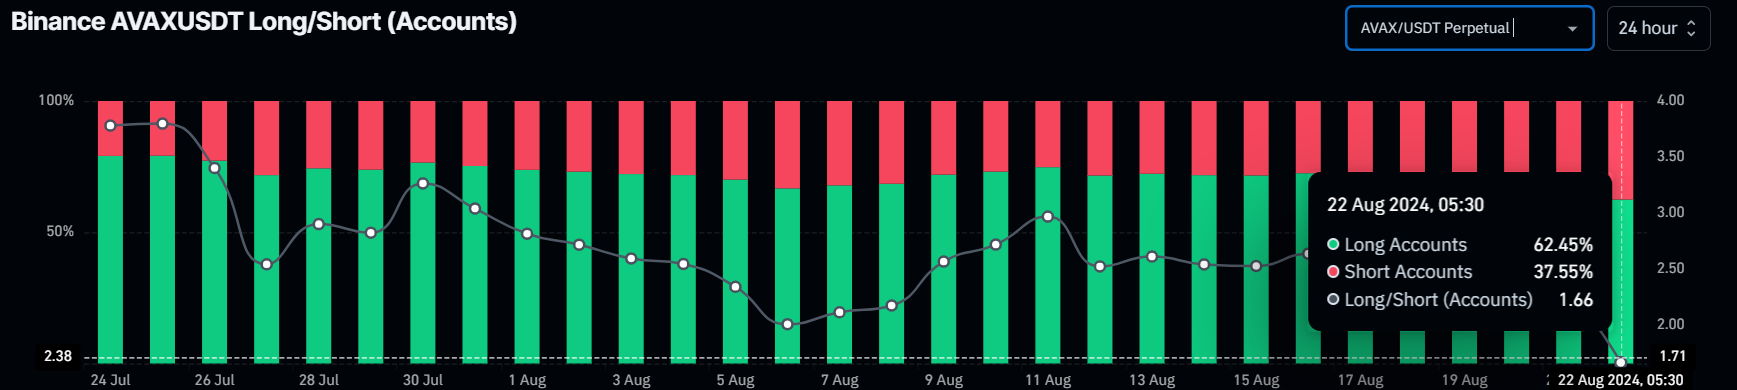
AVAX long-to-short ratio chart
Despite the bullish thesis signaled by both on-chain data and technical analysis, the outlook will shift to bearish if Avalanche's daily candlestick closes below the August 16 low of $19.73. This scenario could lead to a 12% crash to retest its low of $17.33 on August 5.
Cryptocurrency metrics FAQs
The developer or creator of each cryptocurrency decides on the total number of tokens that can be minted or issued. Only a certain number of these assets can be minted by mining, staking or other mechanisms. This is defined by the algorithm of the underlying blockchain technology. Since its inception, a total of 19,445,656 BTCs have been mined, which is the circulating supply of Bitcoin. On the other hand, circulating supply can also be decreased via actions such as burning tokens, or mistakenly sending assets to addresses of other incompatible blockchains.
Market capitalization is the result of multiplying the circulating supply of a certain asset by the asset’s current market value. For Bitcoin, the market capitalization at the beginning of August 2023 is above $570 billion, which is the result of the more than 19 million BTC in circulation multiplied by the Bitcoin price around $29,600.
Trading volume refers to the total number of tokens for a specific asset that has been transacted or exchanged between buyers and sellers within set trading hours, for example, 24 hours. It is used to gauge market sentiment, this metric combines all volumes on centralized exchanges and decentralized exchanges. Increasing trading volume often denotes the demand for a certain asset as more people are buying and selling the cryptocurrency.
Funding rates are a concept designed to encourage traders to take positions and ensure perpetual contract prices match spot markets. It defines a mechanism by exchanges to ensure that future prices and index prices periodic payments regularly converge. When the funding rate is positive, the price of the perpetual contract is higher than the mark price. This means traders who are bullish and have opened long positions pay traders who are in short positions. On the other hand, a negative funding rate means perpetual prices are below the mark price, and hence traders with short positions pay traders who have opened long positions.
Author

Manish Chhetri
FXStreet
Manish Chhetri is a crypto specialist with over four years of experience in the cryptocurrency industry.


