- Nonfarm Payrolls in the US increased by 517,000, 2.5 times higher than the forecast of 185,000.
- The jobs data came in higher than expectations, which bodes well for the US Dollar, but could trigger a sell-off in risk-on markets like Bitcoin or stock markets.
- With a massive spike in jobs, average hourly earnings came in at expectations, 0.3%.
The United States unemployment rate for January came in at 3.4% which is lower than forecast of 3.6%. The Nonfarm Payrolls (NFP) data shows that 517,000 jobs were added in January, which is much higher than the expected 185,000. The last important component in the jobs sector is the average hourly earnings year-over-year which landed at 4.4% as opposed to the expected 4.9%.
To put it simply, the jobs data is bullish for the US Dollar but a threat to the risk-on markets and the rally it experienced at the Federal Reserve's policy meeting on February 1. Hence, market participants need to exercise cautions as a short-term sell-off in the equities and cryptocurrencies could be around the corner.
If the disinflation, as suggested by the Fed Chairman Jerome Powell continues, the interest rate hikes will remain at 25 basis points or lower, allowing the committee to achieve their highly-anticipated soft landing.
Also read: Bitcoin Weekly Forecast: Nonfarm Payrolls on the radar after Powell’s speech propels BTC higher
Bitcoin price feels the effects of higher NFP print
Bitcoin market participants’ excitement from the US Federal Reserve’s rate hike dovish commentary faded after the release of the US jobs data. Since the NFP showed an addition of 571,000 in January, the bullish outlook seen over the last 24 hours seems to be winding down, which can be seen in BTC’s 4.24% drop.
A stronger jobs report where the actual data exceeds expectations is generally seen as a positive development of economic conditions. Hence, it promotes a strong US Dollar, which in turn results in a sell-off in risk-on assets.
The weekly, three-day and daily charts show a sell-signal or signs of exhaustion. The weekly chart, in particular, shows that BTC is close to tagging the 200-week Simple Moving Average (SMA), which could result in a rejection.
Additionally, the one-day chart also shows the presence of a bearish divergence, which could result in a sell-off with the NFP data acting as a catalyst.
The $23,000 to $18,600 support zone is extremely important for traders should BTC nosedive in the coming hours.
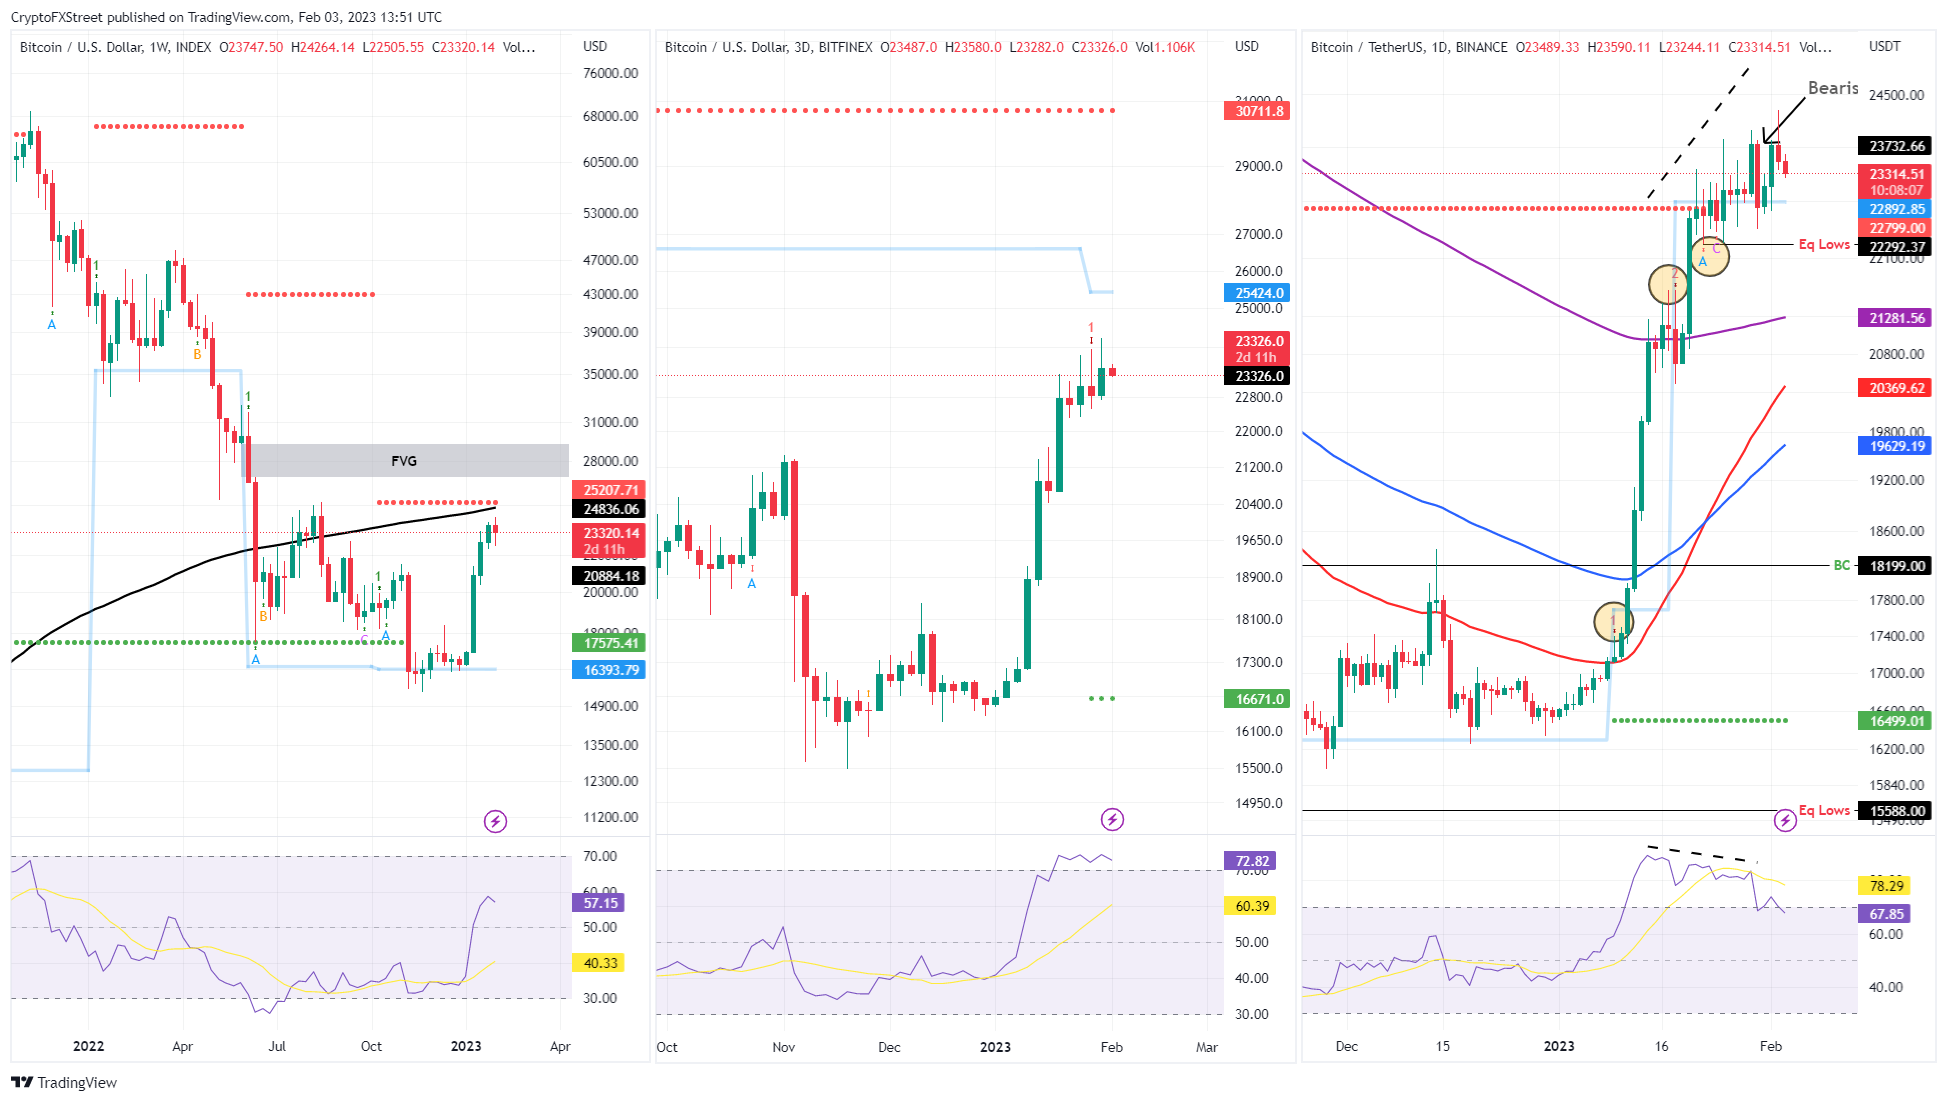
BTC/USDT chart
Information on these pages contains forward-looking statements that involve risks and uncertainties. Markets and instruments profiled on this page are for informational purposes only and should not in any way come across as a recommendation to buy or sell in these assets. You should do your own thorough research before making any investment decisions. FXStreet does not in any way guarantee that this information is free from mistakes, errors, or material misstatements. It also does not guarantee that this information is of a timely nature. Investing in Open Markets involves a great deal of risk, including the loss of all or a portion of your investment, as well as emotional distress. All risks, losses and costs associated with investing, including total loss of principal, are your responsibility. The views and opinions expressed in this article are those of the authors and do not necessarily reflect the official policy or position of FXStreet nor its advertisers. The author will not be held responsible for information that is found at the end of links posted on this page.
If not otherwise explicitly mentioned in the body of the article, at the time of writing, the author has no position in any stock mentioned in this article and no business relationship with any company mentioned. The author has not received compensation for writing this article, other than from FXStreet.
FXStreet and the author do not provide personalized recommendations. The author makes no representations as to the accuracy, completeness, or suitability of this information. FXStreet and the author will not be liable for any errors, omissions or any losses, injuries or damages arising from this information and its display or use. Errors and omissions excepted.
The author and FXStreet are not registered investment advisors and nothing in this article is intended to be investment advice.
Recommended Content
Editors’ Picks
Ethereum supply shrinks by 70,000 ETH. Will Ethereum price hit $2,000?

Ethereum transition from Proof-of-Work to Proof-of-Stake (PoS) was the last major upgrade to the altcoin’s blockchain and the Shanghai hard fork is the next one. The shift to PoS purged 70,000 ETH tokens from the altcoin’s circulating supply.
Decentraland Price Forecast: What to expect from MANA as Metaverse Fashion Week kicks off

Decentraland price (MANA) has identified critical support on day one of the Metaverse Fashion Week. The token is trading horizontally on the four-hour timeframe as bulls push to break above a descending trendline.
Ethereum devs confirm withdrawals to begin on April 12; Here's what to expect from ETH price

Ethereum is on the verge of bringing about one of the biggest upgrades to the blockchain since the Merge. The arrival of withdrawals has been anticipated for a long time now, however, it may not be as lucrative for Ethereum price as one might expect.
Ripple holders' profit taking hits a 19-month high as XRP price shoots up by 42%
XRP price has performed beyond expectations and has marked a multi-month high, restoring confidence in its investors. These holders have also made the most of the situation and turned to sell, which could backfire on the price action soon.
Bitcoin: Should you trust this BTC sell signal or wait for $34,000?

Bitcoin price shows a clear picture of its rally after it breached a long-term bullish pattern in mid-January. As the rally takes a breather, sell signs have started to emerge, which is putting investors in a confused state.