ApeCoin price to rise from the ashes with a 90% breakout
- Apecoin price is coiling in a triangular fashion
- APE price is coming back into buyers' territory on the Relative Strength Index
- Invalidation for the bullish symmetrical triangle is a touch at $9.30

Apecoin price is consolidating in what appears to be a triangle. The NFT Indexed coin can rally 90% based on this pattern.
Apecoin could make new all time highs
Apecoin price has puzzled traders as the digital asset has embarked on multiple trend changes since its first massive rally in March. Last week analysts projected a 20% sell-off into the $9 zone. The bears have only conquered 25% of the grounds since the bearish thesis was issued, which warrants analysts to reconsider the strength of the bears.
Now it seems there may be a reason for the back and forth price action as a triangle pattern takes form. Large rallies usually follow triangles, so catching the next APE price movement could be very profitable. The triangle's low to apex forecasts a potential 90% rally from the current price of $10.93. This APE price could surge to all-time highs towards $26. The price discovery in the said area could further the FOMO madness.
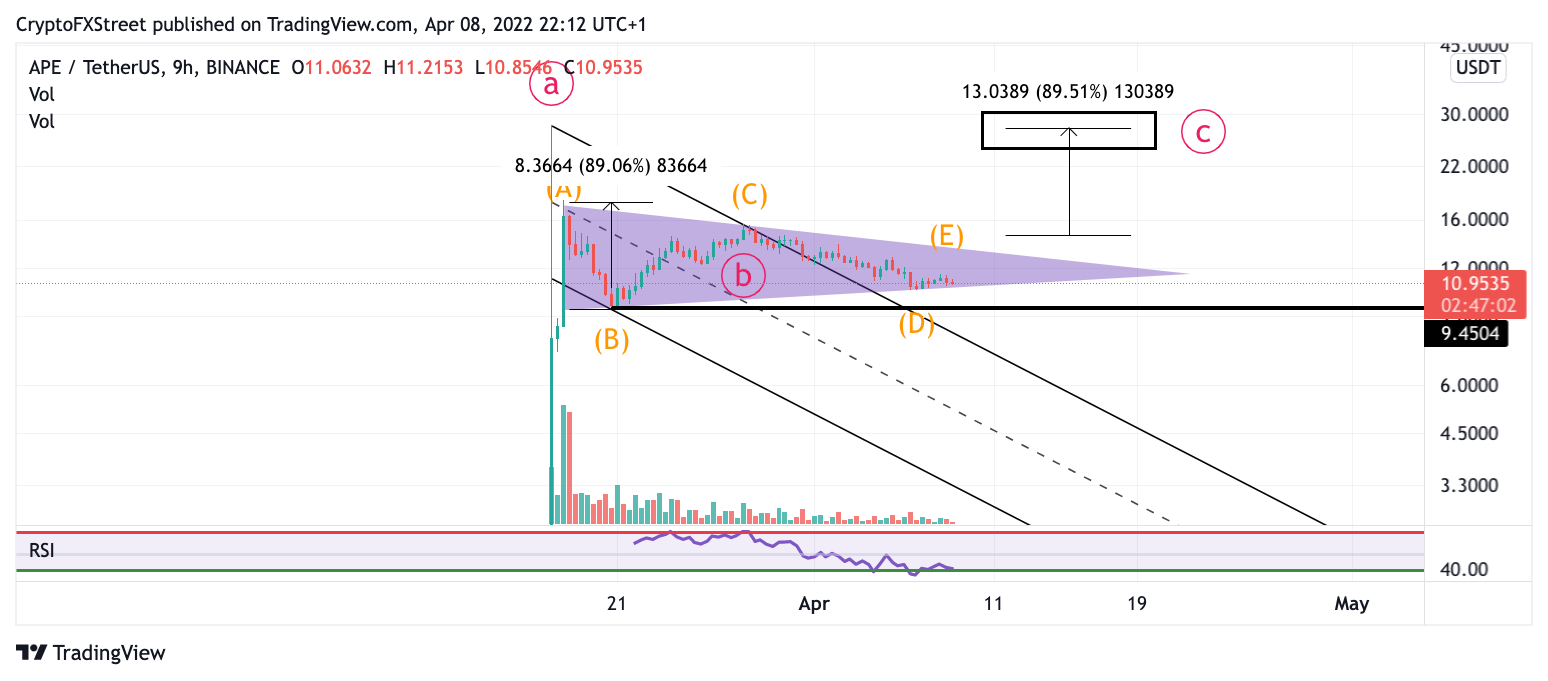
APE/USDT 9-Hour Chart
Apecoin price has yet to decide which direction the triangle will break out from. But it was worth noting that the Relative Strength Index is coming back into buyer's territory on the 9-hour chart.
Investors willing to take an early risk should keep their invalidation level tight. Apecoin price should not breach the $9.36 level if this bullish symmetrical triangle is correct. If the bears manage to breach $9.36, the Ape coin price could drop 80%, bringing the price back to $2.50.
Author
FXStreet Team
FXStreet
Composed of a group of economic journalists and FX experts, the FXStreet content team produces and oversees all content published on FXStreet. It provides a purely journalistic approach to the Forex market.


