- ApeCoin price has suffered extreme volatility, with stiff bull vs. bear competition concealing the next directional bias.
- The impending breakout will dictate whether APE could potentially move to the $6.000 or $2.993 resistance and support levels, respectively.
- The direction of the next major move can only be determined after a valid breakout.
ApeCoin price is at crossroads after trading within a symmetrical triangle on the one-day chart. The altcoin is in a neutral formation reliant on the impending breakout that will determine the direction of the next move. The pattern contains at least two lower highs and two higher lows. When these points are connected, the lines converge as they are extended, and the symmetrical triangle takes shape. It is wide at the beginning and narrows over time. The direction of the next major move could be determined after a valid breakout.
ApeCoin price at crossroads
ApeCoin price is trapped within a neutral formation and is trading around $4.068 at the time of writing. An increase in buying pressure from current levels could see the altcoin break out of the upper boundary of the governing pattern. If this happens, the price could soar 100% to tag the bullish target at the $8.3000 resistance level.
Given the onset of the alt season, the upswing for ApeCoin price is doable, where investing in altcoins provides better returns than Bitcoin or Ethereum. To hit the target, APE must break above the upper boundary of the chart pattern to confront the 50- and 100-day Exponential Moving Averages (EMAs) at $4.709 and $4.774, respectively.
A break above the two slower-moving EMAs could set the ApeCoin price to fight the $4.994 resistance level because of a confrontation with the 200-day EMA at $5.220. In a highly bullish case, the altcoin could shatter the $6.000 barrier before a leg up to its bullish target at $8.300. This move would denote a 100% ascent from current levels.
Notably, this target for ApeCoin price is equal to the distance from the high and low of the earliest part of the pattern applied to the breakout price point.
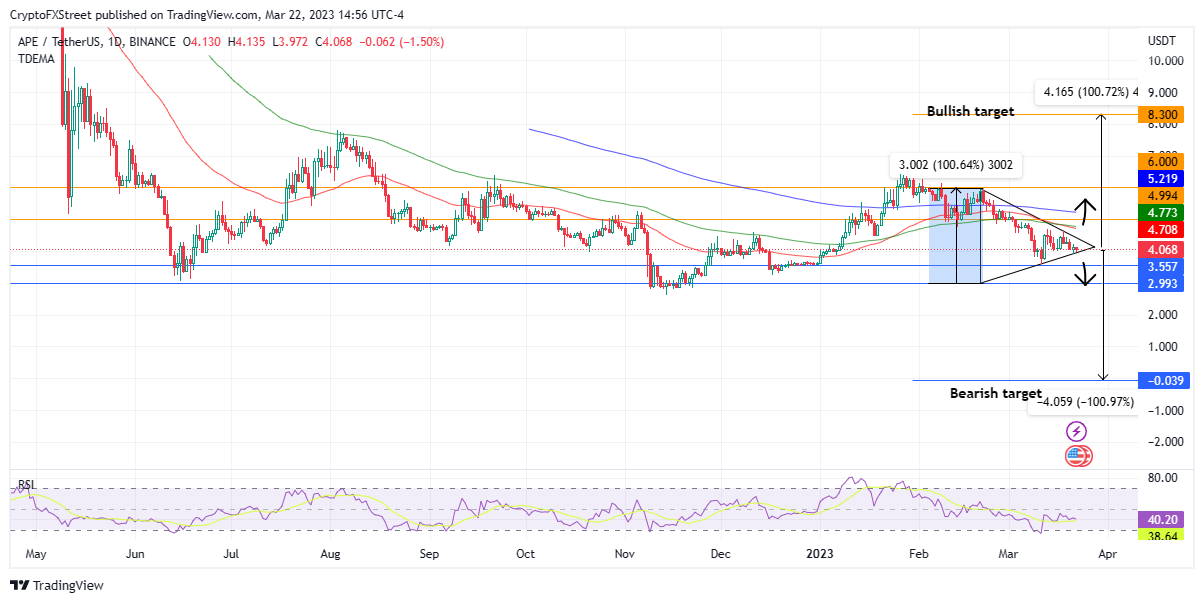
APE/USDT 1-day chart
Conversely, if bears take the day, ApeCoin price could break below the lower boundary of the governing pattern and confront the $3.557 support level before tagging the $2.993 support level. In extreme cases, APE could descend 100% to its bearish target.
Information on these pages contains forward-looking statements that involve risks and uncertainties. Markets and instruments profiled on this page are for informational purposes only and should not in any way come across as a recommendation to buy or sell in these assets. You should do your own thorough research before making any investment decisions. FXStreet does not in any way guarantee that this information is free from mistakes, errors, or material misstatements. It also does not guarantee that this information is of a timely nature. Investing in Open Markets involves a great deal of risk, including the loss of all or a portion of your investment, as well as emotional distress. All risks, losses and costs associated with investing, including total loss of principal, are your responsibility. The views and opinions expressed in this article are those of the authors and do not necessarily reflect the official policy or position of FXStreet nor its advertisers. The author will not be held responsible for information that is found at the end of links posted on this page.
If not otherwise explicitly mentioned in the body of the article, at the time of writing, the author has no position in any stock mentioned in this article and no business relationship with any company mentioned. The author has not received compensation for writing this article, other than from FXStreet.
FXStreet and the author do not provide personalized recommendations. The author makes no representations as to the accuracy, completeness, or suitability of this information. FXStreet and the author will not be liable for any errors, omissions or any losses, injuries or damages arising from this information and its display or use. Errors and omissions excepted.
The author and FXStreet are not registered investment advisors and nothing in this article is intended to be investment advice.
Recommended Content
Editors’ Picks
Dogecoin price bullish outlook intensifies as DOGE turns 10

Dogecoin price has sustained the bullish outlook since October 18, when the broader market turned green, leading meme coins in an uptrend, which is no mean feat. The 65% climb has ushered the dog-themed cryptocurrency to its tenth birthday since its official launch on December 6, 2013.
Bitcoin-based meme coin ORDI price action wobbles after 1,100% rally

The Bitcoin-based BRC-20 meme coin, which had people confused as being an actual valuable token, is now slowly creeping up to that status. ORDI price rise over the past couple of days has been astonishing, and with BTC driving the price and crossing $44,000, ORDI is also gaining rapidly. But not for long.
Arbitrum price veers as hard fork proposal receives 99.84% votes in favor

Arbitrum's price surpassed expectations as the altcoin managed to restrict the fluctuation over the past 24 hours. This is because ARB was forecasted to rally following the result of the proposal to essentially hard-fork the chain.
Bitcoin price hits $44,000 as Coinbase CEO speculates BTC could be key to extending Western civilization

Bitcoin (BTC) price has revisited levels last seen in April 2022, prior to the collapse of the Terra UST ecosystem. Its foray above the $42,000 psychological level has market watchers enthused.
Analyzing potential $30k corrections ahead of BTC ETF approval

Bitcoin has slowed down its 2023 bull rally as it approaches the $37,000 level. After three weeks of consolidating around this level, BTC shows no directional bias whatsoever. Some investors speculate this could be an upward-sloping accumulation that leads to a $40,000 rally.