ANKR price soars 40% over reports of Ankr execs to attend NVIDIA GTC 2024 Conference, AI narrative still on
- ANKR price recorded an intra-day high of $0.0569 on Thursday amid AI conference-related news.
- Ankr CEO and CTO will attend the NVIDIA GTC 2024 conference in Silicon Valley in March.
- With the Conference still ten days out, AI wave is not yet done, unlike meme coin mania.
AI crypto coin enthusiasts still have their eyes peeled to the March 18-21 event in Silicon Valley, where Nvidia will hold the largest conference in its history, christened NVIDIA GTC24 Conference.
Ankr executives to attend NVIDIA 2024 GTC Conference
Web3 data analysis tool has reported that Ankr CEO and CTO Chandler Song and Stanley Wu will be among the crypto executives to attend the Nvidia conference in Silicon Valley. Based on the report, the ANKR price exploded 40% following this news.
The #AI token $ANKR soared ~40% as #Ankr CEO @chandlersyf and CTO @stanleywu84 will attend the #NVIDIA #GTC24 conference! pic.twitter.com/4mXy5KVqf1
— Lookonchain (@lookonchain) March 7, 2024
At the time of writing, ANKR price is trading for $0.0501 amid ongoing profit-taking as traders cash in on the 40% explosion. Nevertheless, the upside potential remains viable, seeing as the Relative Strength Index (RSI) is climbing, a sign of rising momentum.
The volume indicator is also showing a pronounced green candlestick, suggesting the intermediate trend is still gaining strength.
With the AI conference still nearly two weeks out, ANKR price could recover some of the ground lost, potentially clearing the $0.0588 peak to tag the $0.0600 psychological level.
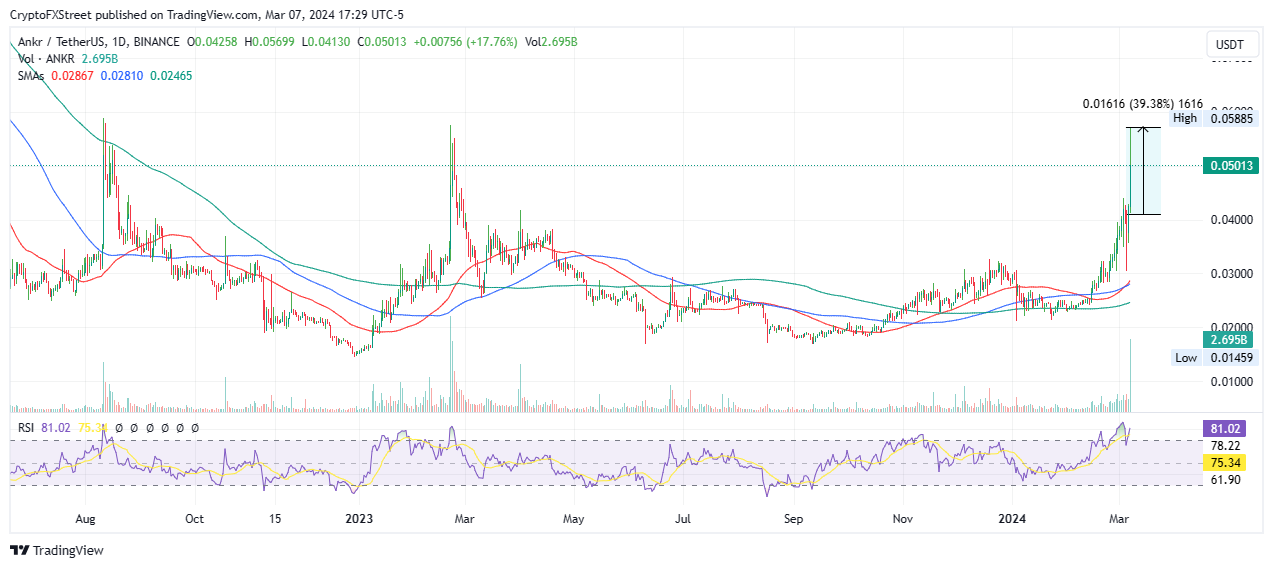
ANKR/USDT 1-day chart
On the other hand, enhanced profit booking could see ANKR price extend the fall, potentially going as low as to test the $0.0300 psychological level.
Notwithstanding, the AI narrative appears to be still on, with sector tokens such as Render (RNDR) and Fetch.ai (FET) still clinging to their previous gains. The same cannot be said for the meme coin cohort, as Dogecoin (DOGE), Shiba Inu (SHIB), Pepe (PEPE) and Bonk Inu (BONK) still on a load-shedding exercise.
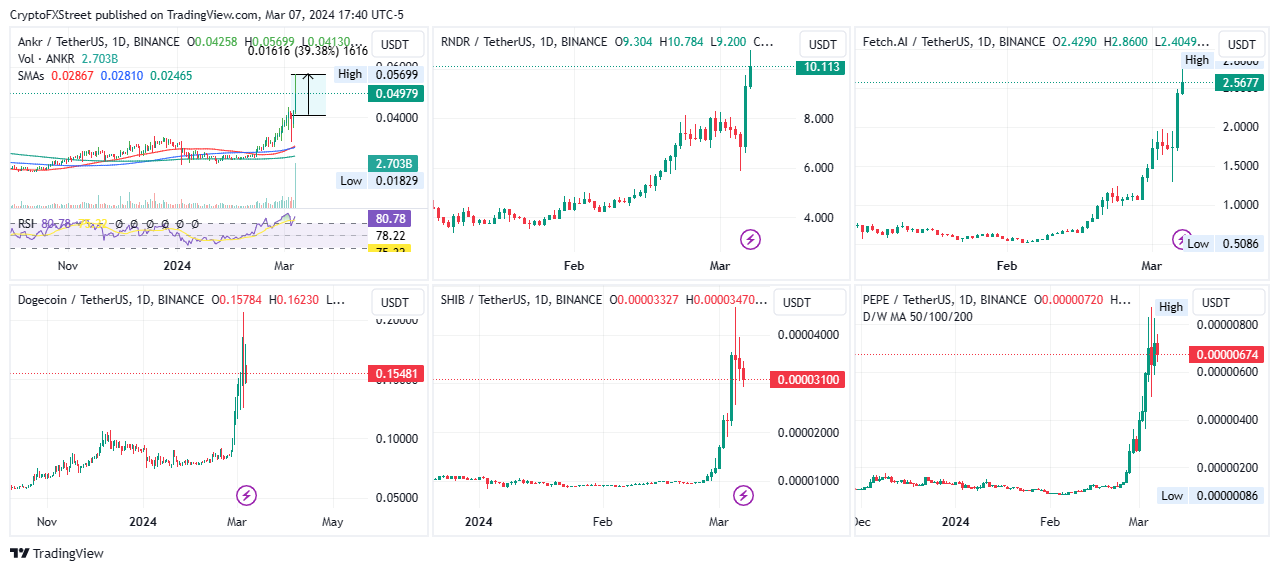
ANKR/USDT 1-day chart, RNDR/USDT 1-day chart, FET/USDT 1-day chart, DOGE/USDT 1-day chart, SHIB/USDT 1-day chart, PEPE/USDT 1-day chart
Author

Lockridge Okoth
FXStreet
Lockridge is a believer in the transformative power of crypto and the blockchain industry.


