Algorand price falls below crucial support for the first time in four months
- Algorand price faell below the 50-day simple moving average (SMA) for the first time since December 23, 2020.
- The Relative Strength Index (RSI) shows a balance between buyers and sellers.
- Investors must watch for support around the psychological level of $1.00.

Algorand price defined an ascending channel for 25 days, just above the 50-day SMA. On Monday, ALGO closed decisively below the lower trendline and the medium-term moving average. It could be a sign of impatience among traders or an alert that a deeper correction is about to unfold.
Algorand price breakdown could be short-lived
A spike in selling did not drive the ALGO decline below the ascending channel and the 50-day SMA. In fact, volume on Monday was 50% below the daily average of 60.88M.
A continuation of the ALGO breakdown will find immediate and substantive support at the convergence of $1.00 with the 0.50 retracement level at $0.98, representing a loss of 14% from the current price level.
Another significant Algorand price level comes in at the August 2019 high and the February 23 low at $0.85. A final but equally important support is at the confluence of the August 2020 high with the 0.618 Fibonacci retracement level at $0.77.
Each of the levels mentioned above present good risk levels for nimble traders, but beware that a price vacuum exists below $0.77.
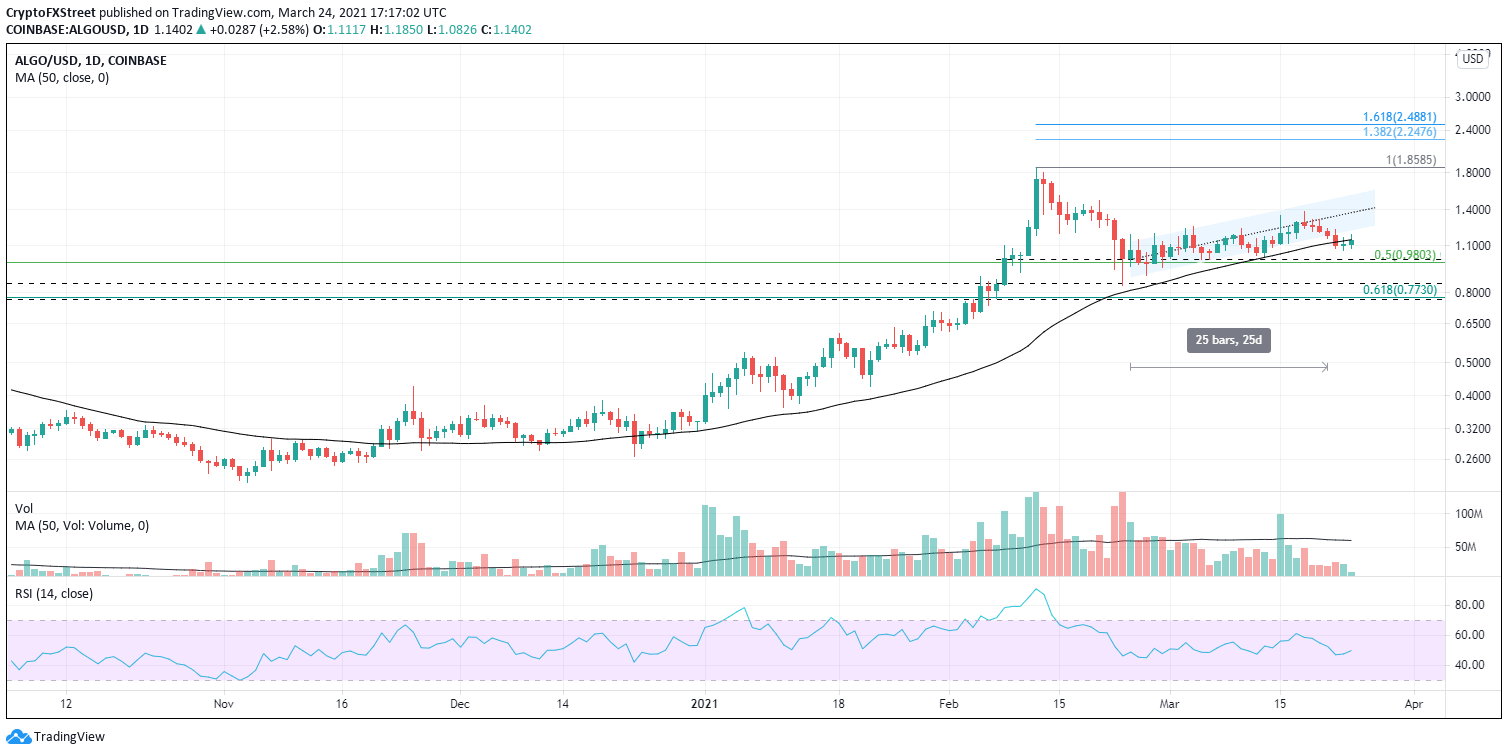
ALGO/USD daily chart
A daily close inside the channel will be the first signal that this week’s weakness is just a shake-out of impatient traders. The channel’s mid-line at $1.38 is a critical resistance going back to March 5, followed by the channel’s upper trendline at $1.54.
In either direction, the ALGO chart has marked support and resistance levels that should keep sharp moves contained in the short-term.
Author

Sheldon McIntyre, CMT
Independent Analyst
Sheldon has 24 years of investment experience holding various positions in companies based in the United States and Chile. His core competencies include BRIC and G-10 equity markets, swing and position trading and technical analysis.


