Aave price poised for an 17% rally after rebounding in key support area
- Aave price rebounded 10% from support area between $76.50 and $72.55 on Monday and trades up 6% near $92.00 on Tuesday.
- Network Realized Profit/Loss metric shows AAVE’s capitulation event on June 22.
- On-chain data shows that AAVE’s daily active address is increasing, signaling greater blockchain usage.
- A daily candlestick close below $72.55 would invalidate the bullish thesis.

Aave (AAVE) price surged 10% following a retest of its critical support area on Monday, now trading 6% higher on Tuesday near $92.00. Recent on-chain data indicates a market capitulation event on June 22, alongside a rise in daily active addresses, suggesting bullish momentum in the days ahead
Aave price shows potential for a rally
Aave price found buyers and bounced off 10% from its support area, extending between $76.50 and $72.55, on Monday. This area had previously acted as a crucial support and resistance, coinciding with the weekly support level of $76.83. Currently, AVVE is 6% up in the European session on Tuesday, trading near $92.00.
If this support area holds, Aave price could rally 17% from $92.00 to its previous weekly resistance at $107.50.
The Relative Strength Index (RSI) on the daily chart is rising from an oversold condition and looking to break above the mean value of 50. The Awesome Oscillator (AO) indicator is below the mean zero level. If bulls are indeed making a comeback, then both momentum indicators must maintain their positions above their respective mean levels. This development would provide additional momentum to the ongoing recovery rally.
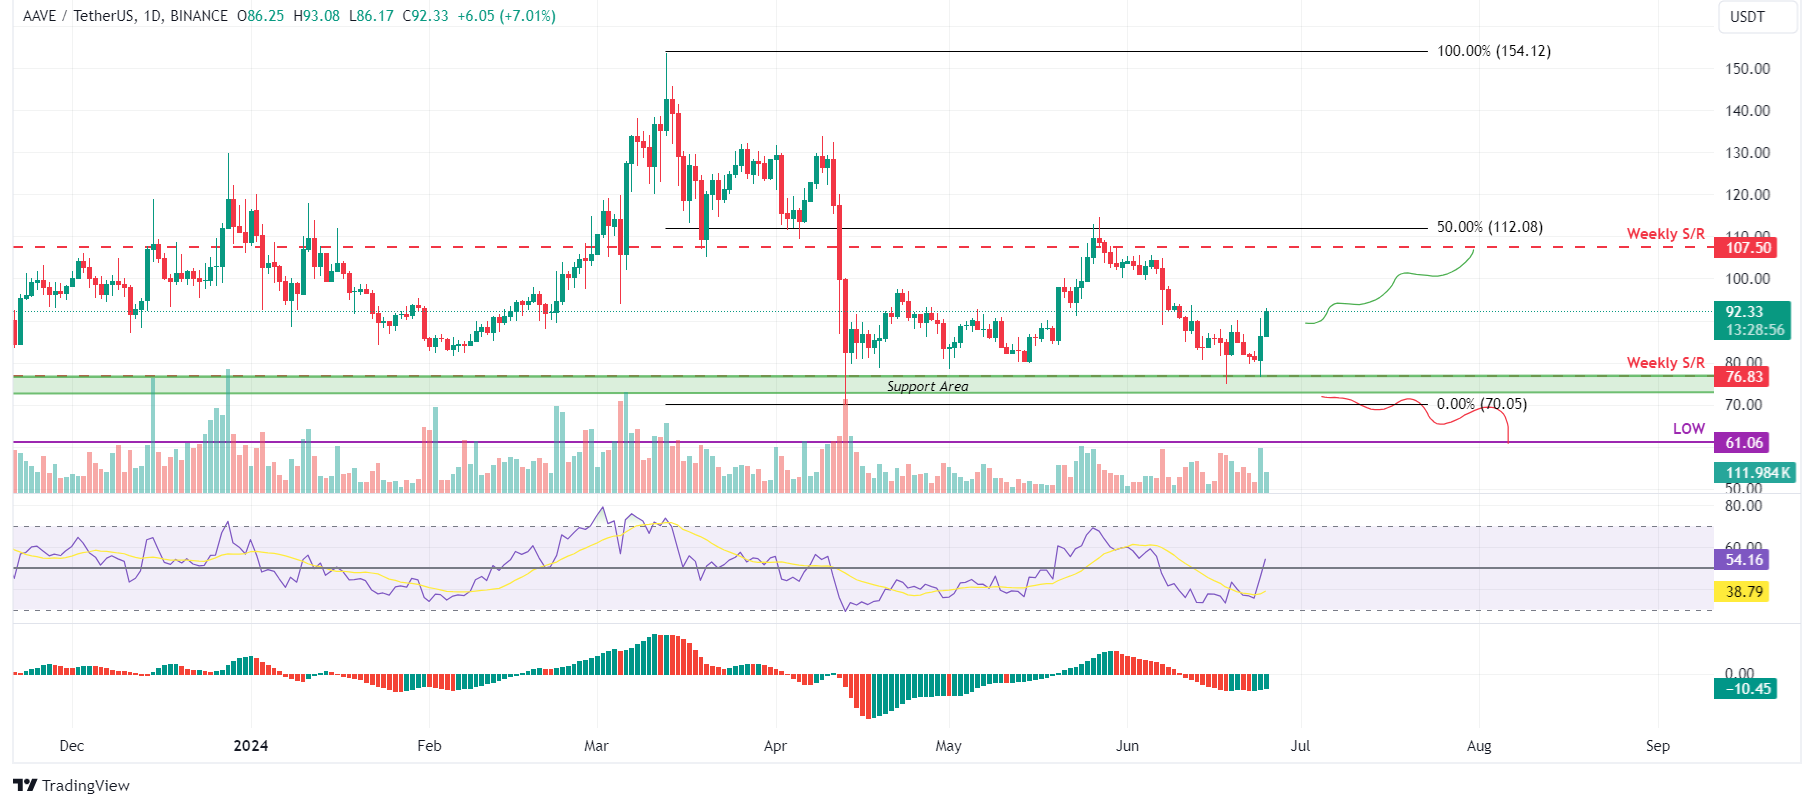
AAVE/USDT daily chart
On-chain data provider Santiment’s Network Realized Profit/Loss (NPL) indicator computes a daily network-level Return On Investment (ROI) based on the coin’s on-chain transaction volume. Simply put, it is used to measure market pain. Strong spikes in a coin’s NPL indicate that its holders are, on average, selling their bags at a significant profit. On the other hand, strong dips imply that the coin’s holders are, on average, realizing losses, suggesting panic sell-offs and investor capitulation.
In Aave’s case, the NPL indicator dipped -55,243 and -2.25 million on June 20 and 22, coinciding with a 6.4% price crash. This negative downtick indicates that the holders were, on average, realizing losses.
During this capitulation event, the Aave’s supply on exchanges declined from 3.18 million to 3.15 million in two days. This decrease in supply on exchanges indicates that the investors are moving AAVE tokens to wallets and reducing selling activity, signaling a bullish outlook, which further denotes investor confidence in AAVE.
%20[13.53.45,%2025%20Jun,%202024]-638549083584508231.png)
AAVE Network Realized Profit/Loss and Supply on Exchanges chart
Santiment’s Daily Active Addresses index, which helps track network activity over time, aligns with the bullish outlook noted from a technical perspective. A rise in the metric signals greater blockchain usage, while declining addresses point to lower demand for the network.
In AAVE’s case, Daily Active Addresses have risen by 26.5% in the last three days. This rise indicates that demand for Aave’s blockchain usage is increasing, which could eventually rally AAVE’s price.
%20[13.53.01,%2025%20Jun,%202024]-638549083949867688.png)
AAVE Daily Active Addresses chart
Even though on-chain metrics and technical analysis point to a bullish outlook, if Aave's price makes a daily candlestick close below $72.55, the bullish thesis would be invalidated by creating a lower low on the daily chart. This development could see AAVE's price crash by 16% to retest its daily low of $61.06 from October 17, 2023.
Author

Manish Chhetri
FXStreet
Manish Chhetri is a crypto specialist with over four years of experience in the cryptocurrency industry.


