AAVE price could rally if a break above this weekly resistance occurs
- AAVE price faces rejection at the weekly resistance level of $107.50, break above it signals a bullish move.
- Lookonchain data shows that whales have accumulated 58,848 AAVE tokens worth $6.47 million in the past two days.
- AAVE's Development Activity is rising, and Supply on Exchange is decreasing, suggesting a bullish outlook.
- A daily candlestick close below $85.75 would invalidate the bullish thesis.

AAVE (AAVE) price faces rejection by the weekly resistance level at $107.50, as of Thursday trades slightly lower by 2.2% at $105.27. On-chain data suggest that AAVE's Development Activity is rising, and Supply on Exchange is decreasing, suggesting a bullish outlook.
Additionally, Lookonchain data shows that whales have significantly increased their holdings of AAVE tokens over the past two days. Notable transactions include address 0x9af4 purchasing $1.23 million worth of AAVE, address 0x790c acquiring $2.38 million worth and depositing it into the AAVE protocol, and address 0xd7c5 acquiring $2.83 million worth.
Whales accumulated 58,848 $AAVE($6.47M) in the past 2 days!
— Lookonchain (@lookonchain) July 31, 2024
0x9af4 withdrew 11,185 $AAVE($1.23M) from #Binance 3 hours ago.https://t.co/Ll2BX1i7Zi
0x790c withdrew 21,619 $AAVE($2.38M) from #Binance 14 hours ago and deposited it into #Aave.https://t.co/xf0hDMnl3p
0xd7c5… pic.twitter.com/HZPhPHKRay
AAVE price looks promising
AAVE price faces a rejection by the weekly resistance level at $107.50, which roughly coincides with the 50% price retracement level at $112.02 drawn from a swing high of $154.06 on March 13 to a swing low of $69.99 on July 5, making this level a key resistance zone.
As of Thursday, AAVE retraces and trades slightly lower by 2.2% at $105.27.
If AAVE continues to retrace, it could find support at the 50-day Exponential Moving Average (EMA), hovering at $95.76. This level roughly coincides with the bullish order block area extending between $92.78 and $89.27 and the ascending trendline drawn from July 5, thus making it a key support zone.
If AAVE bounces off from $92.78, it could rally 15.5% to retest its weekly resistance at $107.50.
This bullish outlook is reinforced by the Relative Strength Index (RSI) and Awesome Oscillator (AO) on the daily chart, comfortably above their neutral levels of 50 and zero, respectively, signaling strong bullish momentum.
If AAVE closes above the $112.02 level, it could extend an additional 18% rally to retest its April 11 high of $132.57.
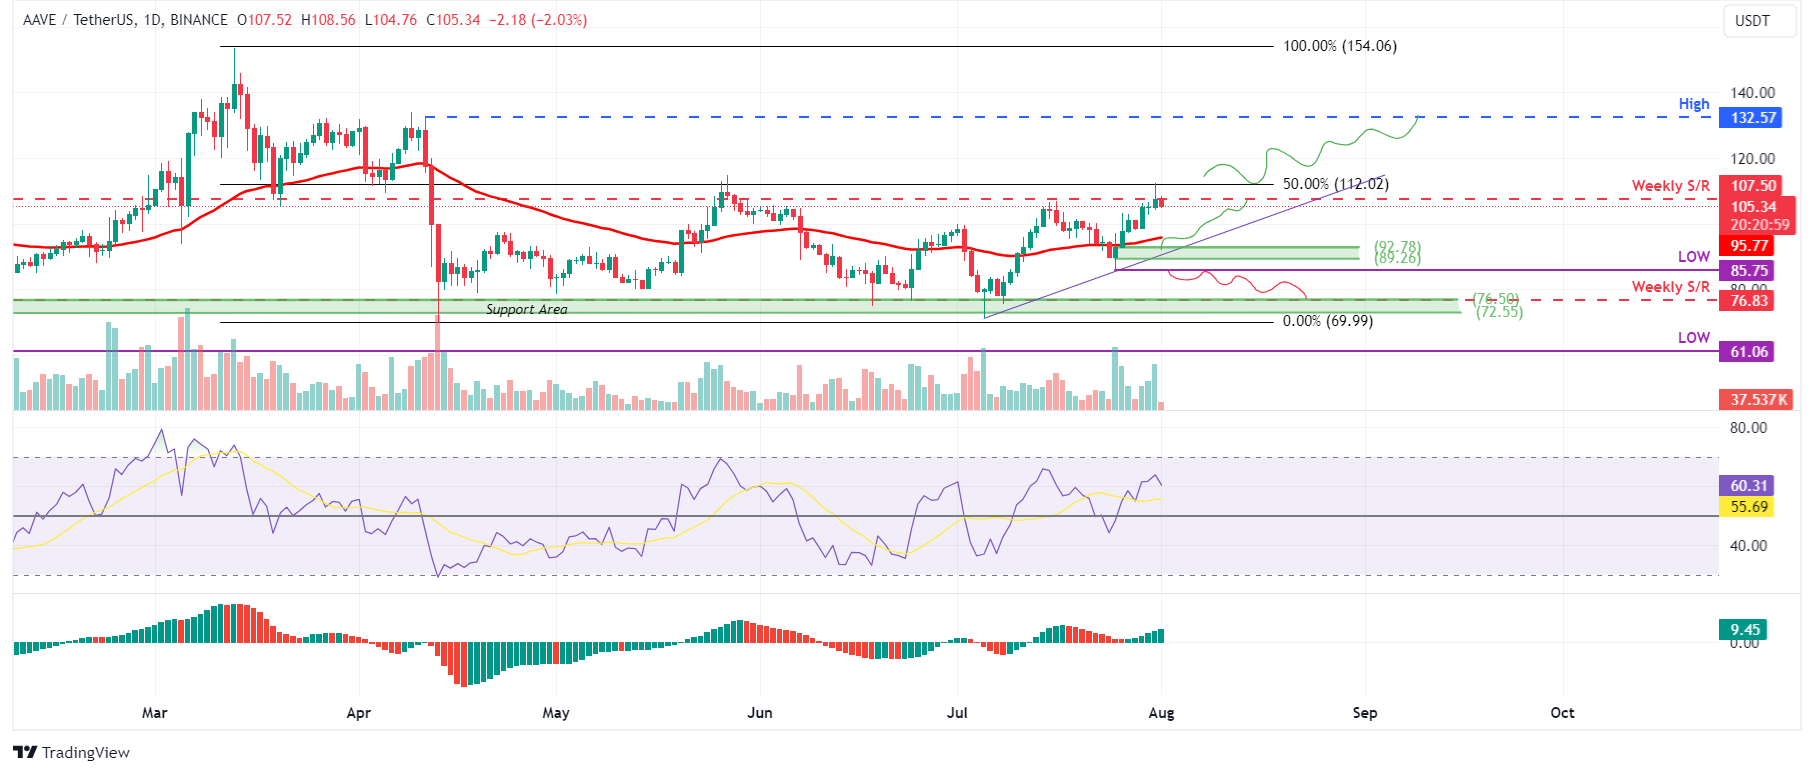
AAVE/USDT daily chart
Santiment's Exchange Flow balance for AAVE shows the net movement of tokens into and out of exchange wallets. A positive value indicates more AAVE entered than exited, suggesting selling pressure from investors. Conversely, a negative value indicates more AAVE left the exchange than entered, indicating less selling pressure from investors.
In AAVE's case, the Exchange Flow balance has slumped from 5,723 to -29,636 this Wednesday. This negative uptick indicates increased buying activity among investors.
During this event, the AAVE Supply on Exchanges declined by 2% in one day, suggesting less selling pressure from investors. This is a bullish development, further denoting investor confidence in AAVE.
%20[08.16.52,%2001%20Aug,%202024]-638580821973965681.png)
AAVE Exchange Flow Balance and Supply of Exchanges chart
Santiment's Development Activity Index shows project development activity over time based on several pure development-related events in the project's public GitHub repository.
In AAVE's case, the index sharply rose from 9 on July 28 to 14.5 on July 31. This trend has been rising since July 24 and implies that the AAVE developing activity is high, which adds further credence to the bullish outlook.
%20[08.16.11,%2001%20Aug,%202024]-638580822558166407.png)
AAVE Development Activity chart
Even though on-chain metrics and technical analysis point to a bullish outlook, if AAVE's price makes a daily candlestick close below $85.75, the bullish thesis would be invalidated by creating a lower low on the daily chart. This development could see AAVE's price decline by 11% to retest its weekly support at $76.83.
Author

Manish Chhetri
FXStreet
Manish Chhetri is a crypto specialist with over four years of experience in the cryptocurrency industry.


