Where is Bitcoin headed?

BTCUSD, D1
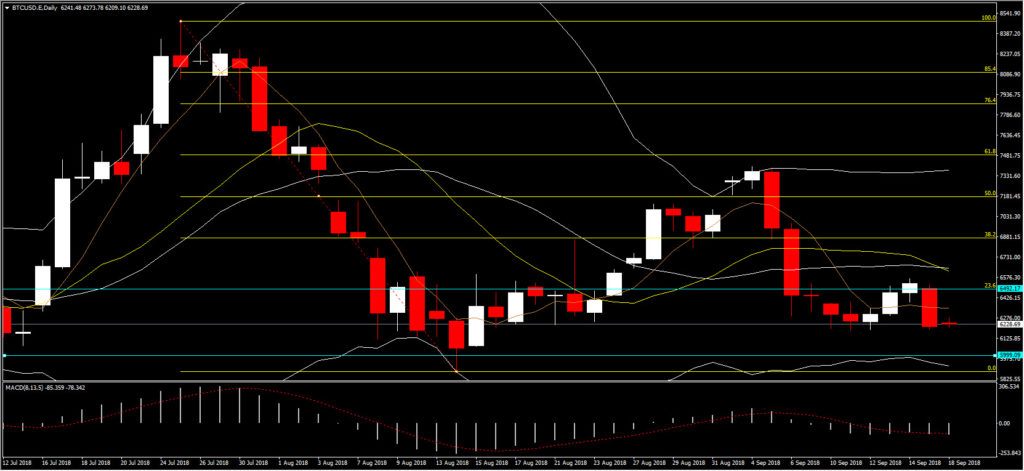
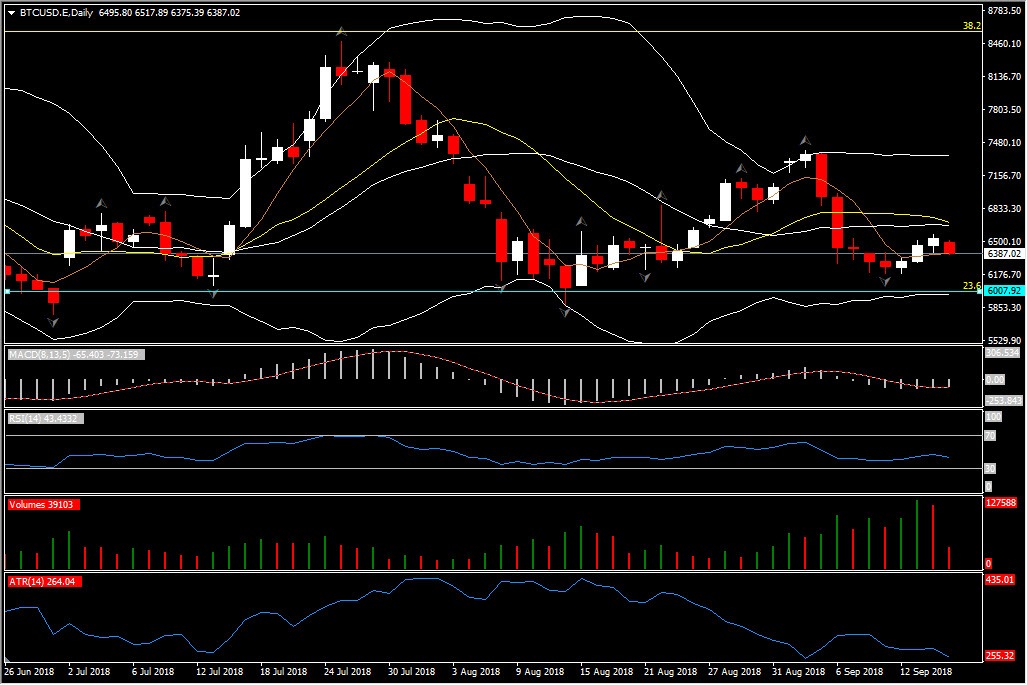
Ever since its December 2017 peak, Bitcoin has been following a downwards trend which appears to have, nonetheless, remained above the peak-to-trough (July 2017-December 2017) 23.6% Fibonacci level at 6008, albeit slowly converging towards it. Indicators are sending off signals of calmness, with RSI remaining withing the 30-70 bound since January, with only minor instances of escaping. Volume indicators are also not providing meaningful patterns, despite their increase since the start of September, and neither is the ATR, which appears to be relatively stable.
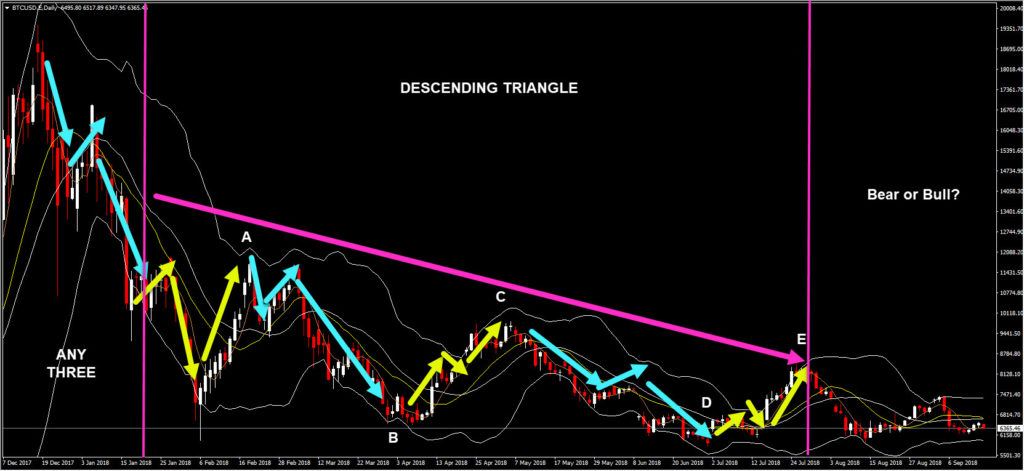
An Elliott Wave analysis does not provide much more information either: the peak in December was followed by a three-movement Wave, and a descending triangle formation. The end of the triangle could either suggest a bear market or another three-movement Wave which could lead to the bull area. At this current juncture, we are still unable to tell.
Gold appears to have a statistically negative relationship with Bitcoin price, suggesting a potential substitution effect between the two instruments, at least for the sample ranging from July 2017 to present. Further to this, Gold appears to have the expected negative relationship with the USDIndex, suggesting that a Dollar appreciation lowers the value of Gold. Interestingly, Bitcoin does not appear to have any statistical relationship with the USDIndex, given that its value does not rely on macroeconomic developments.
Where does that leave us then? At this juncture, the USDIndex appears to be on a downwards trend, while the price of Gold appears to have stabilised. This stabilisation is also evident in the Bitcoin price, which has been fluctuating between the 0% and 23.6% Fib. levels since the beginning of September. The band is quite large, ranging from 5880 to 6492, with no closing price below the USD6000 psychological barrier in the past year, other than a trough in June which was followed by an immediate reaction. Consequently, the big question is whether Bitcoin will break below this barrier, with 5- and 14-day moving averages pointing to that direction. Still, it could be the case that this trend may reverse if other news comes to light.
Author

With more than 4 years of experience at the Central Bank of Cyprus where he obtained hands-on experience with real-life economics, Dr Nektarios Michail is a supporter of a balanced approach between science and art when it comes to


