I few things that I look for is:
- Clear support and resistance levels
- Clear market swings
Once I have that, I can figure out what the market is likely to do in the following hours/days.
And today, one of the clearest currency pairs to trade is the AUDNZD, and here is why.
AUDNZD Long term analysis
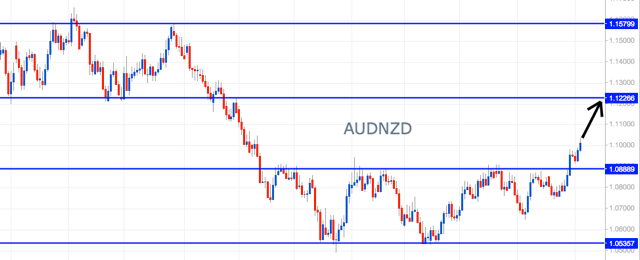
First of all, let me show you the daily chart:

The first thing that you notice in this chart is that its got clear S&R levels, and that makes me feel very comfortable looking for trade opportunities here.
The second thing that you notice here is that it just broke through an important resistance level (1.0888).
One of the main principles of technical analysis is that most of the time, the market moves from one level to the other.
With that being said, it is likely for the AUDNZD to reach its next LT resistance level which is at 1.1226.
I’ll look for long opportunities here until the AUDNZD reaches its next resistance level.
Now we need to look for our entry in the short term charts.
AUDNZD Short term chart analysis
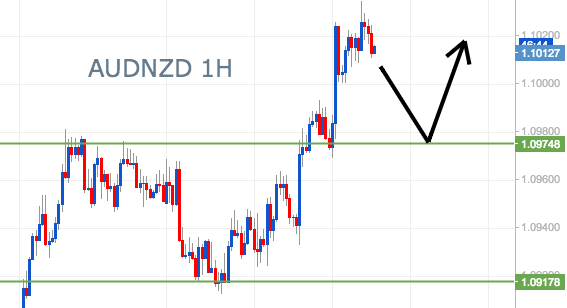
Here is the hourly chart:

Now, you can use any system to look for your entry level, but I like to use classic support and resistance levels.
So my strategy here would be to wait for the market to retrace back to the ST support level (1.0974) to look for upward pressure to go long.
What do you think about my trading plan for the AUDNZD?
Recommended Content
Editors’ Picks
EUR/USD holds below 1.0750 ahead of key US data

EUR/USD trades in a tight range below 1.0750 in the European session on Friday. The US Dollar struggles to gather strength ahead of key PCE Price Index data, the Fed's preferred gauge of inflation, and helps the pair hold its ground.
GBP/USD consolidates above 1.2500, eyes on US PCE data

GBP/USD fluctuates at around 1.2500 in the European session on Friday following the three-day rebound. The PCE inflation data for March will be watched closely by market participants later in the day.
Gold clings to modest daily gains at around $2,350

Gold stays in positive territory at around $2,350 after closing in positive territory on Thursday. The benchmark 10-year US Treasury bond yield edges lower ahead of US PCE Price Index data, allowing XAU/USD to stretch higher.
Bitcoin Weekly Forecast: BTC’s next breakout could propel it to $80,000 Premium

Bitcoin’s recent price consolidation could be nearing its end as technical indicators and on-chain metrics suggest a potential upward breakout. However, this move would not be straightforward and could punish impatient investors.
US core PCE inflation set to signal firm price pressures as markets delay Federal Reserve rate cut bets

The core PCE Price Index, which excludes volatile food and energy prices, is seen as the more influential measure of inflation in terms of Fed positioning. The index is forecast to rise 0.3% on a monthly basis in March, matching February’s increase.