What Does Wall Street See that These Charts Don’t?

Wall Street continues to be convinced that the economy is edging back up again after a stall following the tax cut boost and near 3% GDP figures in 2018.
I talked last Monday about how there were some key indicators like industrial production growth and construction spending that were not confirming such a resurgence… at least not yet. And such falling trends tend to be a leading indicator of falling profits.
This chart is more disturbing, as it comes from those very CEOs that got the direct benefits from the tax cuts at the beginning of 2018. Their confidence in the economy is not just slowing, it is plunging!
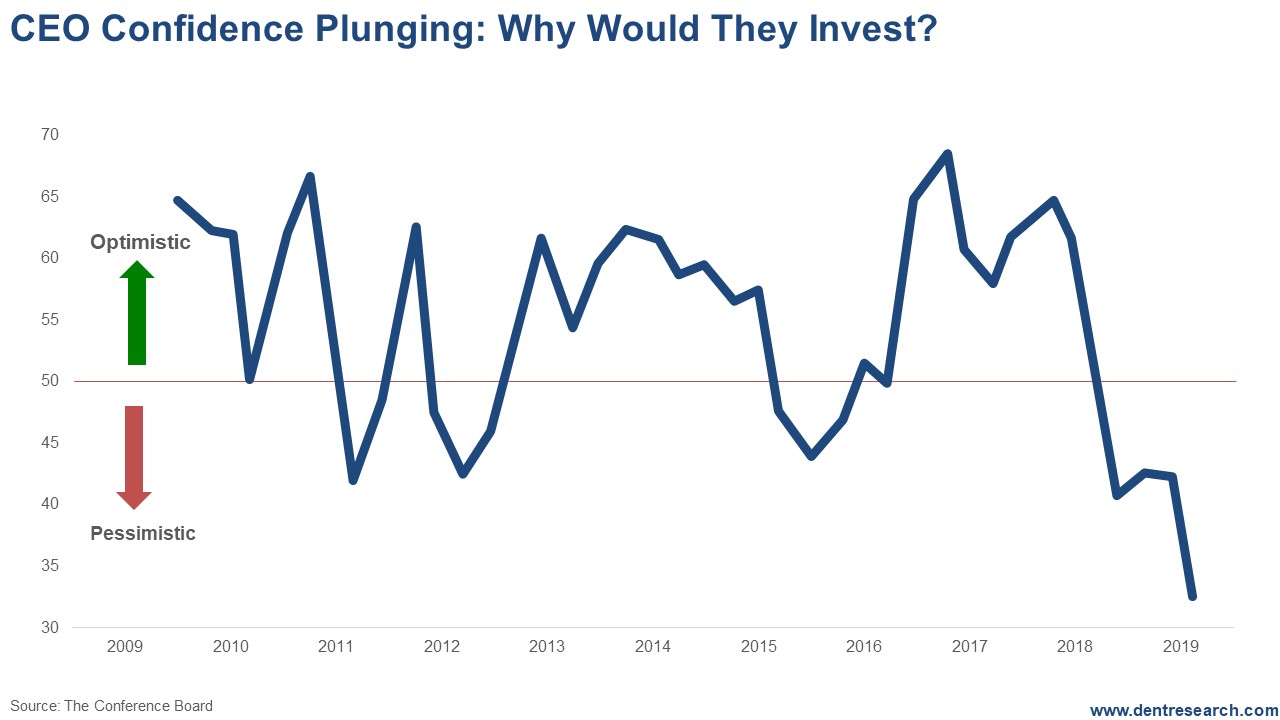
They clearly and haven’t been making significant investments in new capacity as they don’t need it. The publicly-traded ones are buying their own stocks to goose earnings per share instead.
But are they seeing signs of declining demand from their customers? Are they worried about Trump getting impeached and ending the corporate tax and deregulation gravy train? All, legitimate concerns, which could accelerate the pending financial crisis. Wall Street is clearly not reacting much to that threat yet.
The next chart also clearly shows that earnings per share are cratering as well. Part of that is to be expected as the surge from the tax cuts does not continue forward. But the actual 4% decline in the third quarter should be alarming.
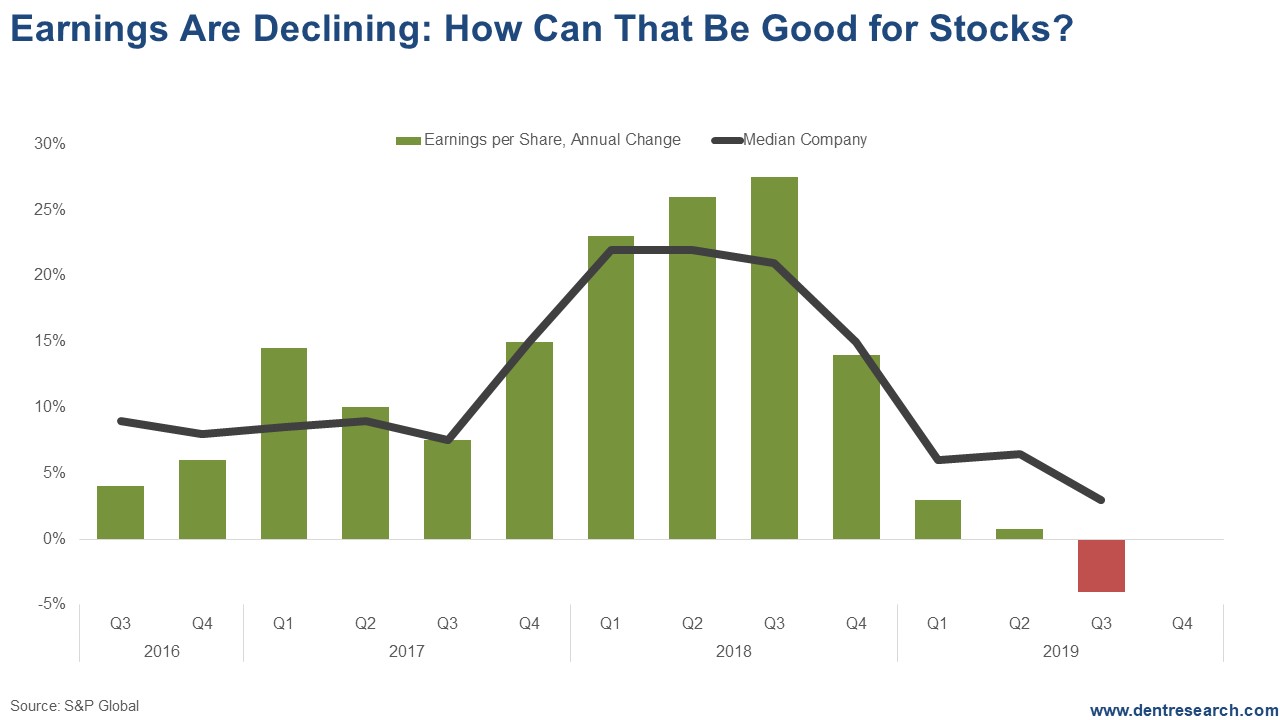
This combination of indicators simply does not bode well for the stock market, yet it keeps edging up. How long can the markets continue to be divorced from Main Street and the real world?
So, what does Wall Street see that these charts don’t?
Good question…
I say it simply sees “more crack” from lower rates and more QE.
How much longer can that last?
Author

Harry S. Dent, MBA
Dent Research
Harry S. Dent Jr. studied economics in college in the ’70s, but found it vague and inconclusive. He became so disillusioned by the state of his chosen profession that he turned his back on it.


