Harry Boxer, On 4 Charts to Watch (TheTechTrader.com)
It was a big day for Wall Street on Monday. The indices gapped up sharply, ran all morning, consolidated all afternoon, and then late in the day they came on to close very strongly.
Among the top charts to watch, Autohome Inc. (ATHM) has been a great swing trade. The stock has been popping out and pulling back nonstop almost between 35.25 and 49.30, rising about 14 in less than two weeks. Beautiful. It is up near resistance at my secondary target at 51 1/2, which it could get to on Tuesday if there's a follow-through.
Enphase Energy, Inc. (ENPH) had a nice pop on Monday, up 55 cents, or 4.35%, on 1.2 million shares. It's surging across the top of the channel, at least the mid-range. It may start to accelerate towards 17-17 1/2, and then maybe 21. There's good volume, good action on this stock.
China Finance Online Co., Ltd. (JRJC) was the monster stock on Monday, opening at 4.70, running up to 7.88, closing at 7.82, up 3.37, or 75%, on 11.8 million shares. It has gotten all the way up to 9.60 in after hours before backing off and closing after hours at 9.21. That's 1.40 above the close, a day in which it was up 3.37, about 125% in one day. The Jan high is just 8.20. This is a big financial service company with a stock trading platform that is going to be approved by the Chinese government. It could be very, very big for them. Look for it to get up around 10-11 on Tuesday.
Sky-mobi Limited (MOBI) had a big pop on Monday, up 1.76, or 26%, on 8 million shares. There's a gap above moving averages, above price resistance, and up where another level of resistance lies. Any follow-through on this stock will test the April high at about 9.65, and beyond that 13 could be a possibility.
Other stocks on Harry's Charts of the Day are Achillion Pharmaceuticals, Inc. (ACHN), Akorn, Inc. (AKRX), Bitauto Holdings Limited (BITA), Canadian Solar Inc. (CSIQ), GoPro, Inc. (GPRO), GT Advanced Technologies Inc. (GTAT), INSYS Therapeutics, Inc. (INSY), InterMune Inc. (ITMN), Kandi Technolgies Group, Inc. (KNDI), LRAD Corporation (LRAD), Mandalay Digital Group, Inc. (MNDL), Tekmira Pharmaceuticals Corp. (TKMR), Tuniu Corporation (TOUR), and Yahoo! Inc. (YHOO).
Avi Gilburt, On Bearish Pattern Remains for Silver & Gold (ElliottWaveTrader.net)
The SPDR Gold Shares ETF (GLD) has simply refused to invalidate the bearish potential on the chart, and silver looks simply terrible.
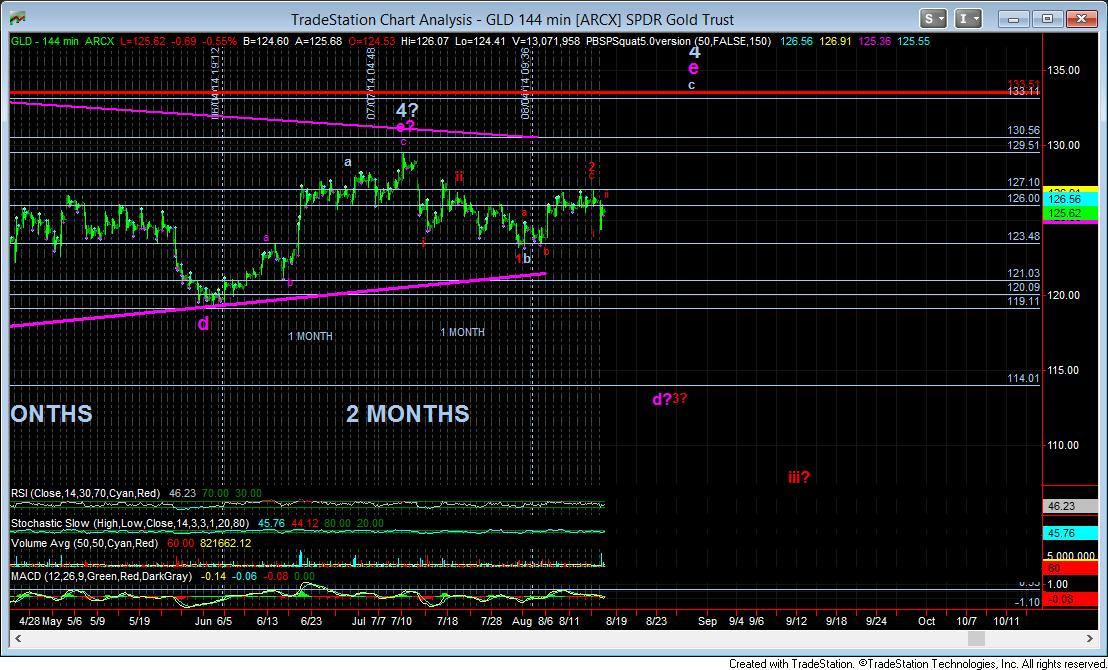
My ideal pattern still had me looking higher to the 130+ region in the GLD. In fact, I noted to members last weekend that was expecting a test of the 124 region. And tested it we did. The low struck this past week was 124.39, before the market moved higher off that level.
As I also said last week, the pattern with which we dropped into that region "should" give us the clues as to whether we will break down further, or if it is a corrective pullback setting up a move higher to the 130+ region. But, unfortunately, I am unable to provide clarity on this perspective, as the market has not provided it to me. The initial drop off the highs has made it a bit unclear to me at this time, so we will have to leave it up to support and resistance over the next week to light the way.
The bare minimum level which MUST be taken out is the 126.07 level. Below that level, and we have a 1-2, i-ii, (1)-(2) (i)-(ii) set up, which means the market can simply fall away quite strongly at the open on Sunday night. However, if the market is able to move through that level, then the main reason of resistance resides at the 127.10 region. If the market is able to move through that region impulsively, then we can view the market as a 1-2 set up off the b-wave low, and in the heart of a 3rd wave in the c-wave targeting at least the 130.50 level, with the potential to extend to the 133.50 level.
So, while the micro structure is not entirely clear, we have solid guidelines as to what we need to watch over the next week. And, should the market chose the bearish perspective follow through, a drop below the 123.21 level opens the door to at least the 119 level, but more likely taking us to a test of the 114/115 region. Assuming we do see those lower levels, we will be watching the structure as well as the technicals to then determine if this is a larger d-wave, or if we are indeed heading to the lower lows sooner rather than later. I think early this coming week will be the tell. If the GLD is not down by 4-5 points early in the week, it makes the potential to reach the 130+ region quite high.
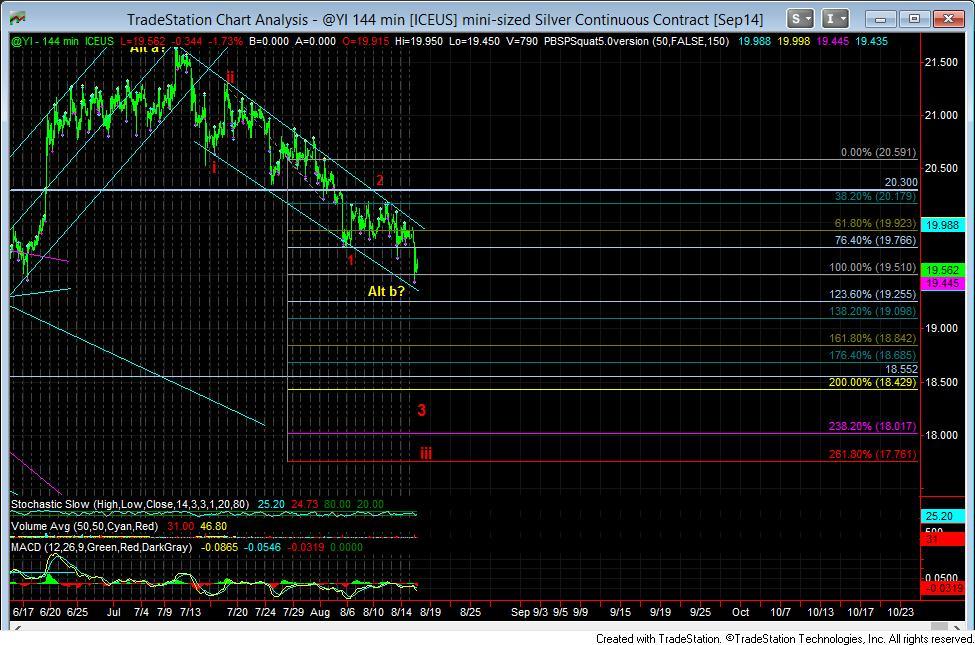
And, as we have been saying for several weeks now, silver still looks quite bearish. Until it is able to at least move over the 19.90 region, and take out the down trend channel it now finds itself within, and then follow through over the 20.20 region, there is nothing to even speak of on the upside in silver. Until those levels are taken out, we can even see silver begin the heart of a 3rd wave down, which is signal by a strong break down below 19.25 early next week.
For those of you that have reviewed the Commitment of Trader's report this past week, you will also know that the commercial traders have become even more bearish over the last week, whereas the larger speculators (usually referring to the hedge funds) have become even more bullish. More often than not, it is the commercial traders that are on the correct side of the next market move, so this is usually looked upon as a very bearish indication. While it is not necessarily an immediately bearish indication and a rally to the 130+ region in GLD can still occur even with a report this bearish, it does mean that attempting to trade for it has become even more risky, at least as long as we are below 127.10.
In conclusion, I have been "hoping" for a run up to the 130+ region in GLD to complete this e-wave of the 4th wave, but the chances of it happening are becoming much slimmer. In fact, early next week should provide us with solid evidence of whether it will happen or not. So, whether you have a bearish or bullish bias - and I know we have some on the elliottwavetrader.net with strong feelings on both sides of this trade - you must recognize the levels of support and resistance I have noted herein. And, please do not maintain your bias if the market provides a clear directional move over the next week, as I suspect it finally will.
Mike Paulenoff, On Weakness in VIX, One More Expected SPX High (MPTrader.com)
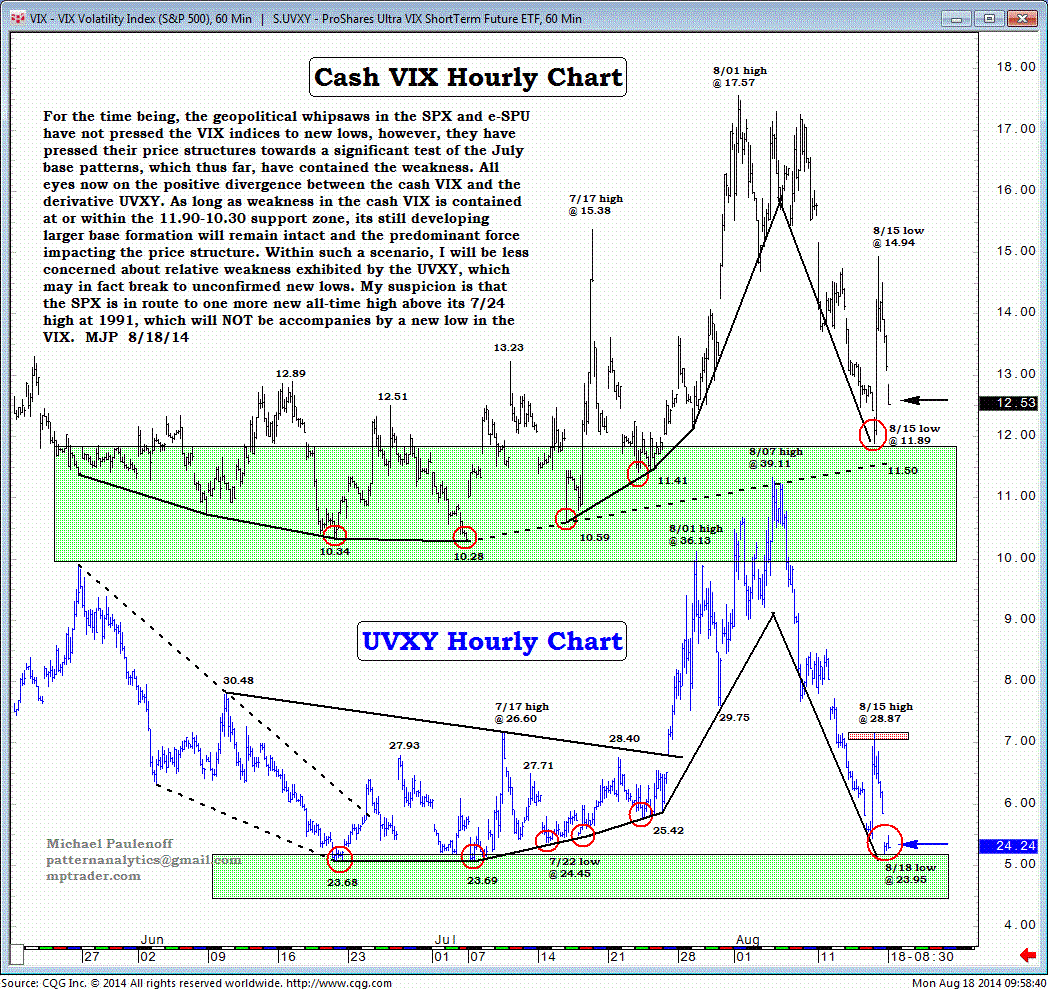
For the time being, the geopolitical whipsaws in the SPX and the e-SPU have not pressed the VIX indices to new lows. However, they have pressed their price structures toward a significant test of the July-base patterns, which, thus far, have contained the weakness.
All eyes now on the positive divergence between the cash VIX and the derivative the ProShares Ultra VIX Short-Term Fut ETF (UVXY).
As long as weakness in the cash VIX is contained at, or within, the 11.90-10.30 support zone, its still developing larger-base formation will remain intact and be the predominant force impacting the price structure.
Within such a scenario, I will be less concerned about relative weakness exhibited by the UVXY, which may, in fact, break to unconfirmed new lows.
My suspicion is that the SPX is in route to one more new all-time high above its July 24 high at 1991, which will not be accompanied by a new low in the VIX.
Sinisa Persich, On Free Stock Pick: RRD (TraderHR.com)
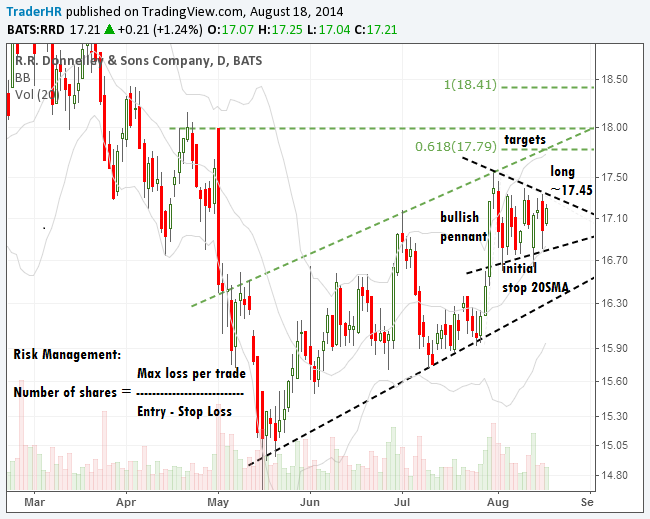
R.R. Donnelley & Sons Company (RRD) has been in a bullish pennant over the last three weeks after a several-session surge of nearly 10% in late July.
If the stock breaks above the current resistance level in the 17.50 area, it is likely we'll see acceleration toward next resistances at the 17.80 level, and then the 18 area. The 20 SMA can be used as initial stop loss.
This Web site is published by AdviceTrade, Inc. AdviceTrade is a publisher and not registered as a securities broker-dealer or investment advisor either with the U.S. Securities and Exchange Commission or with any state securities authority. The information on this site has been obtained from sources considered reliable but we neither guarantee nor represent the completeness or accuracy of the information. In addition, this information and the opinions expressed are subject to change without notice. Neither AdviceTrade nor its principals own shares of, or have received compensation by, any company covered or any fund that appears on this site. The information on this site should not be relied upon for purposes of transacting securities or other investments, nor should it be construed as an offer or solicitation of an offer to sell or buy any security. AdviceTrade does not assess, verify or guarantee the suitability or profitability of any particular investment. You bear responsibility for your own investment research and decisions and should seek the advice of a qualified securities professional before making any investment.
Recommended Content
Editors’ Picks
AUD/USD gains momentum above 0.6500 ahead of Australian Retail Sales data

AUD/USD trades in positive territory for six consecutive days around 0.6535 during the early Asian session on Monday. The upward momentum of the pair is bolstered by the hawkish stance from the Reserve Bank of Australia after the recent release of Consumer Price Index inflation data last week.
EUR/USD: Federal Reserve and Nonfarm Payrolls spell action this week

The EUR/USD pair temporarily reconquered the 1.0700 threshold last week, settling at around that round level. The US Dollar lost its appeal following discouraging United States macroeconomic data indicating tepid growth and persistent inflationary pressures.
Gold trades on a softer note below $2,350 on hotter-than-expected US inflation data

Gold price trades on a softer note near $2,335 on Monday during the early Asian session. The recent US economic data showed that US inflationary pressures staying firm, which has added further to market doubts about near-term US Federal Reserve rate cuts.
Ethereum fees drops to lowest level since October, ETH sustains above $3,200

Ethereum’s high transaction fees has been a sticky issue for the blockchain in the past. This led to Layer 2 chains and scaling solutions developing alternatives for users looking to transact at a lower cost.
Week ahead: Hawkish risk as Fed and NFP on tap, Eurozone data eyed too

Fed meets on Wednesday as US inflation stays elevated. Will Friday’s jobs report bring relief or more angst for the markets? Eurozone flash GDP and CPI numbers in focus for the Euro.


