Weekly waves: EUR/USD, XAU/USD and Bitcoin
-
The EUR/USD break below the support zone (dotted green), which indicated a larger bearish move rather than a bullish correction.
-
The BTC/USD (Bitcoin) is facing three different scenarios, which are indicated by s1, s2, and s3 (green).
-
Gold (XAU/USD) has made a strong bullish bounce (reversal?) at the 50% Fibonacci retracement level.

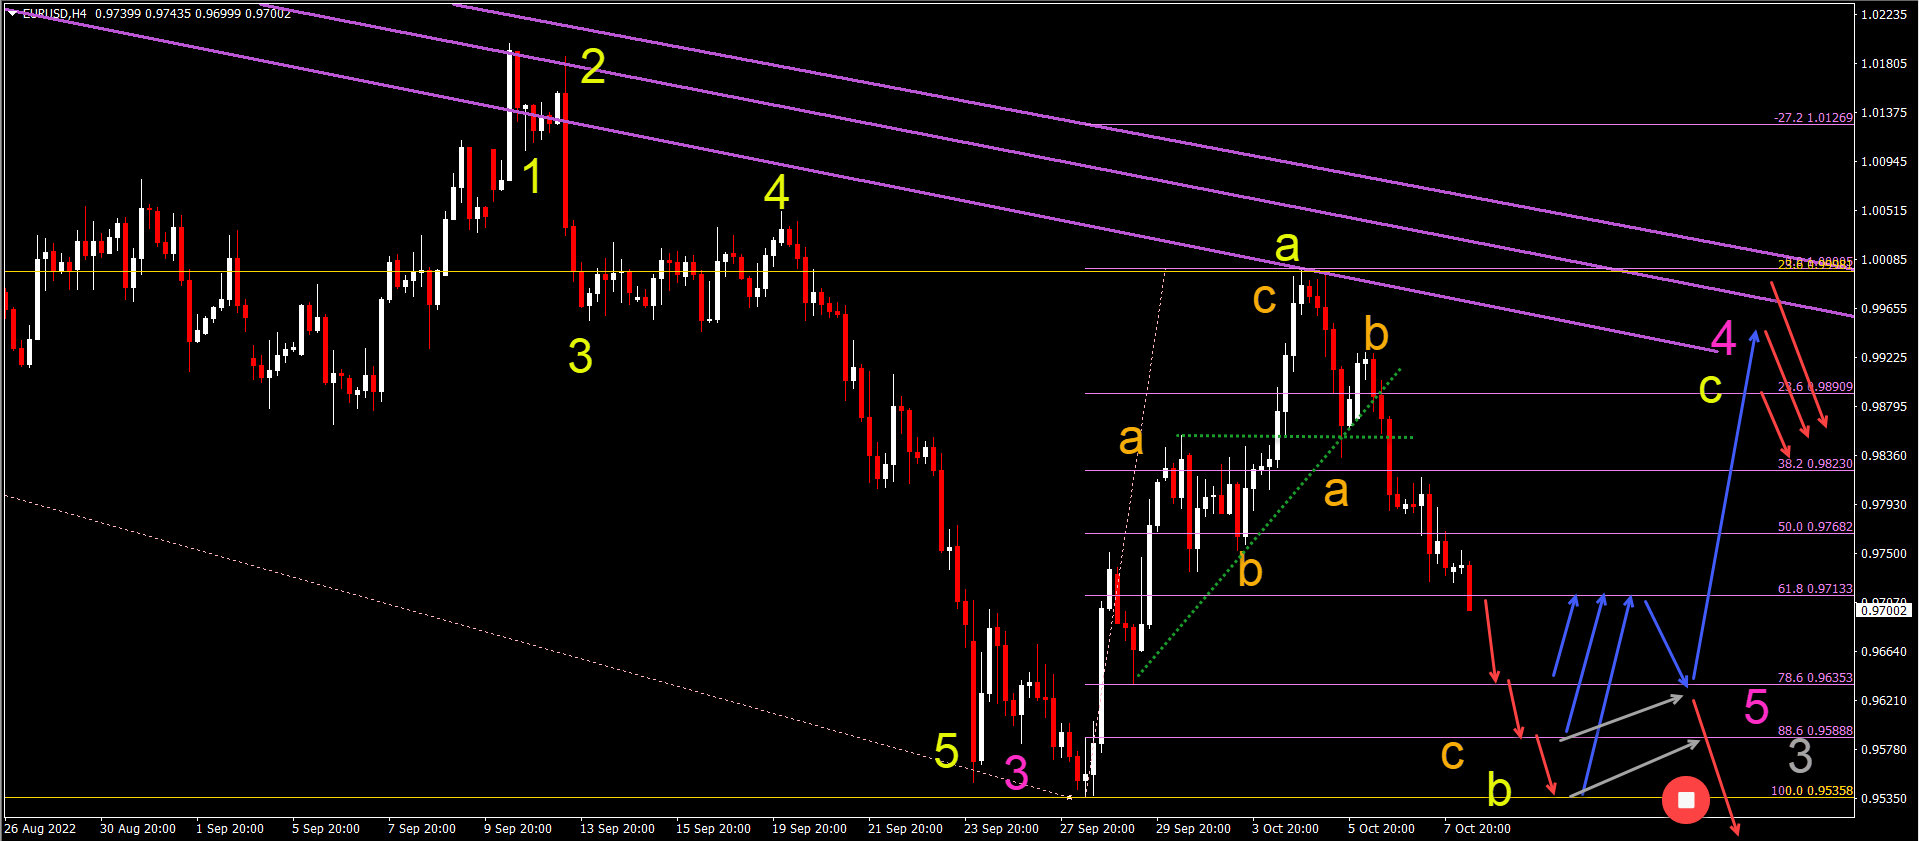
EUR/USD bearish decline in ABC pattern
The EUR/USD break below the support zone (dotted green), which indicated a larger bearish move rather than a bullish correction:
-
The EUR/USD is probably building a bearish ABC (orange) pattern.
-
The ABC (orange) should complete a wave B (yellow) of a larger ABC (yellow).
-
The ABC (yellow) pattern could complete a wave 4 (pink).
-
Price action could fall towards the deeper Fibonacci levels or the previous bottom.
-
A bullish bounce could retest the resistance lines (purple) and 23.6% Fibonacci level.
-
A bear flag pattern (gray lines) followed by a bearish break invalidates the bullish ABC and indicates an immediate downtrend.
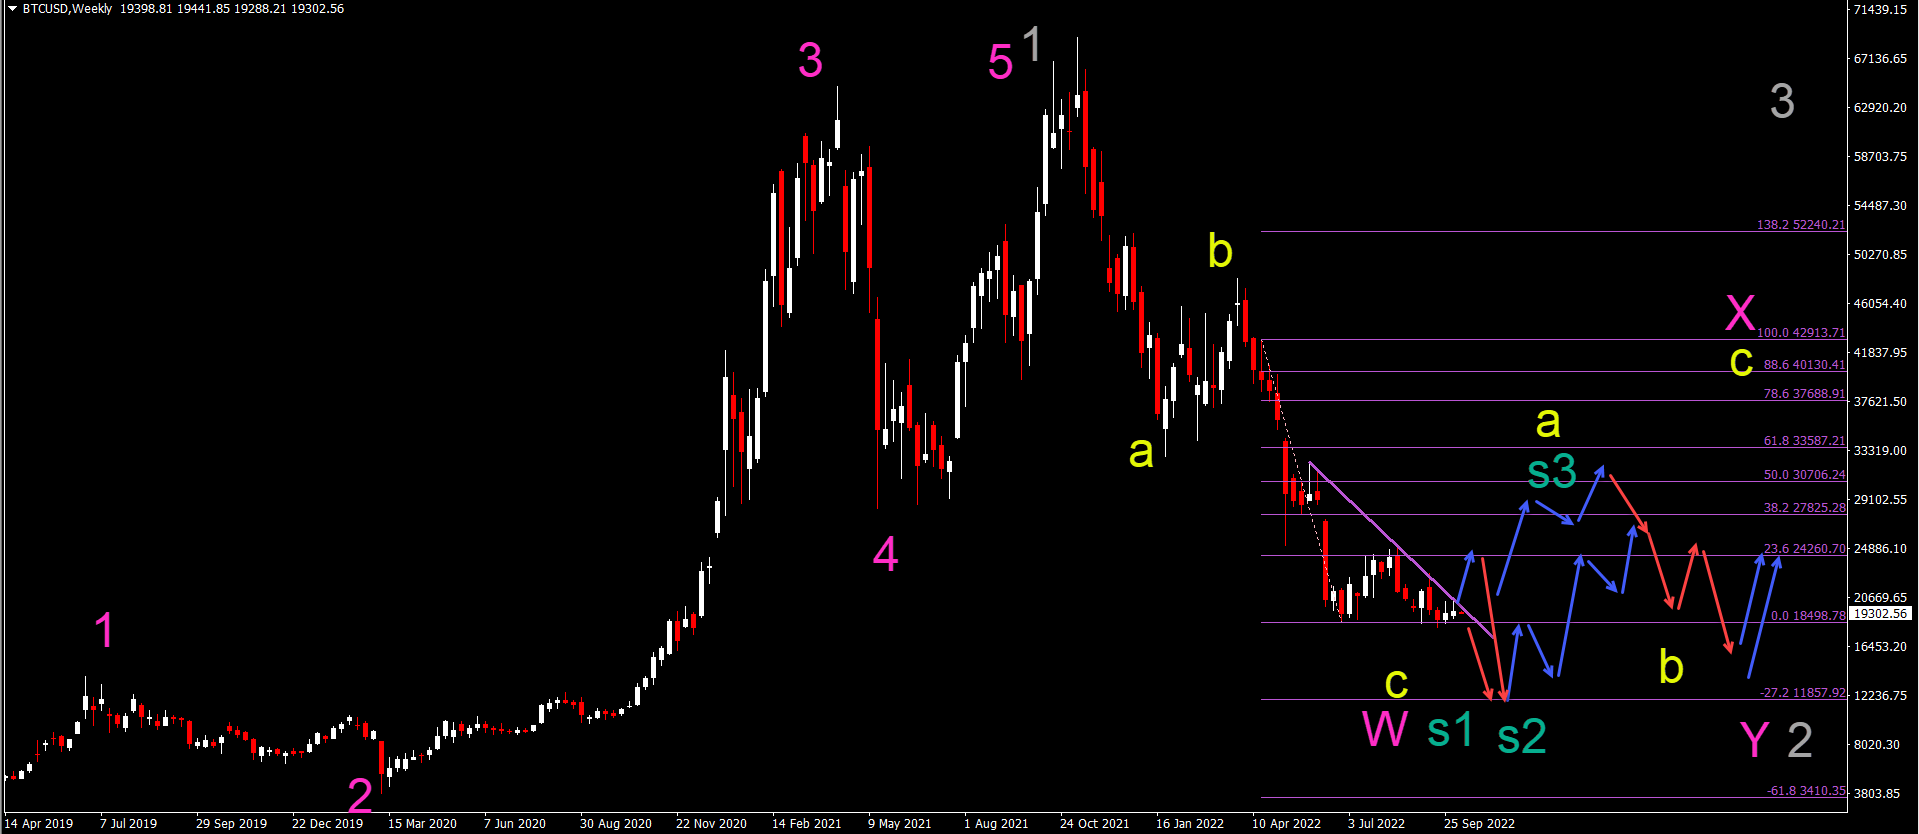
Bitcoin testing solid and key support
The BTC/USD (Bitcoin) is facing three different scenarios, which are indicated by s1, s2, and s3 (green):
-
The first scenario (s1 green) is indicating an immediate bearish breakout towards the -27.2% Fibonacci target.
-
The second scenario (s2 green) is indicating a retest of the resistance and then a bounce towards the same Fib target. Both s1 and s2 are part of wave C (yellow)
-
The third scenario (s3 green) is indicating a larger bullish retracement within a wave A (yellow) of a larger wave X (pink).
-
Eventually, the wave C (yellow) should complete a wave W (pink).
-
A larger WXY (pink) correction is expected within wave 2 (gray).
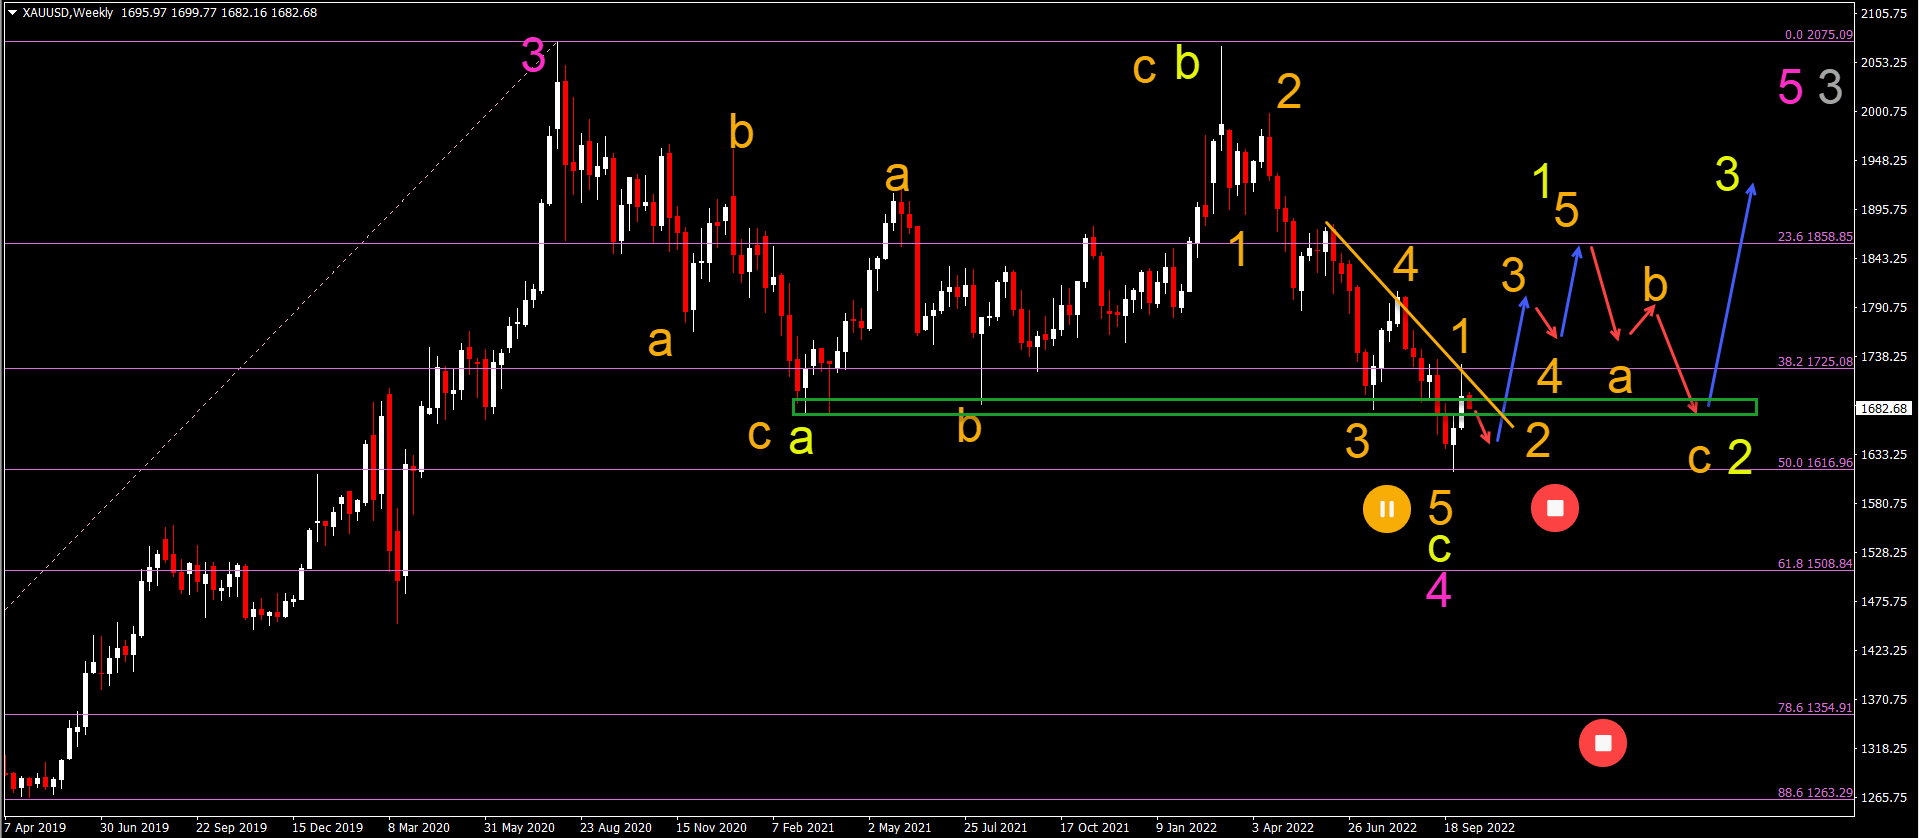
XAU/USD bullish bounce or reversal at 50% fibonacci
Gold (XAU/USD) has made a strong bullish bounce (reversal?) at the 50% Fibonacci retracement level:
-
The Gold bounce at the 50% Fib could confirm the end of the wave 4 (pink).
-
A larger wave 5 (orange) of a wave C (yellow) could have completed at the 50% Fib.
-
The strong bullish bounce could be a wave 1-2 (orange) of a larger wave 1 (yellow).
-
This bullish reversal could remain valid as long as price action stays above the bottom at the 50% Fibonacci level.
The analysis has been done with the indicators and template from the SWAT method simple wave analysis and trading. For more daily technical and wave analysis and updates, sign-up to our newsletter
Author

Chris Svorcik
FS method
Chris Svorcik is a trader, analyst, and educator with over 15 years of experience in financial markets, specializing in moving averages, market structure, and price patterns.


