• The EUR/USD remains trapped between the 0.95 support level and parity (1.00) resistance zone

  • A bearish breakout (orange arrow) below the support zone (blue) could confirm a drop towards the $15k and $12k support zones.

  • NGAS is dropping lower quickly as we anticipated last week.  The bearish decline has been marked as a wave 3 (green).

EUR/USD trapped between 0.95 and 1.00

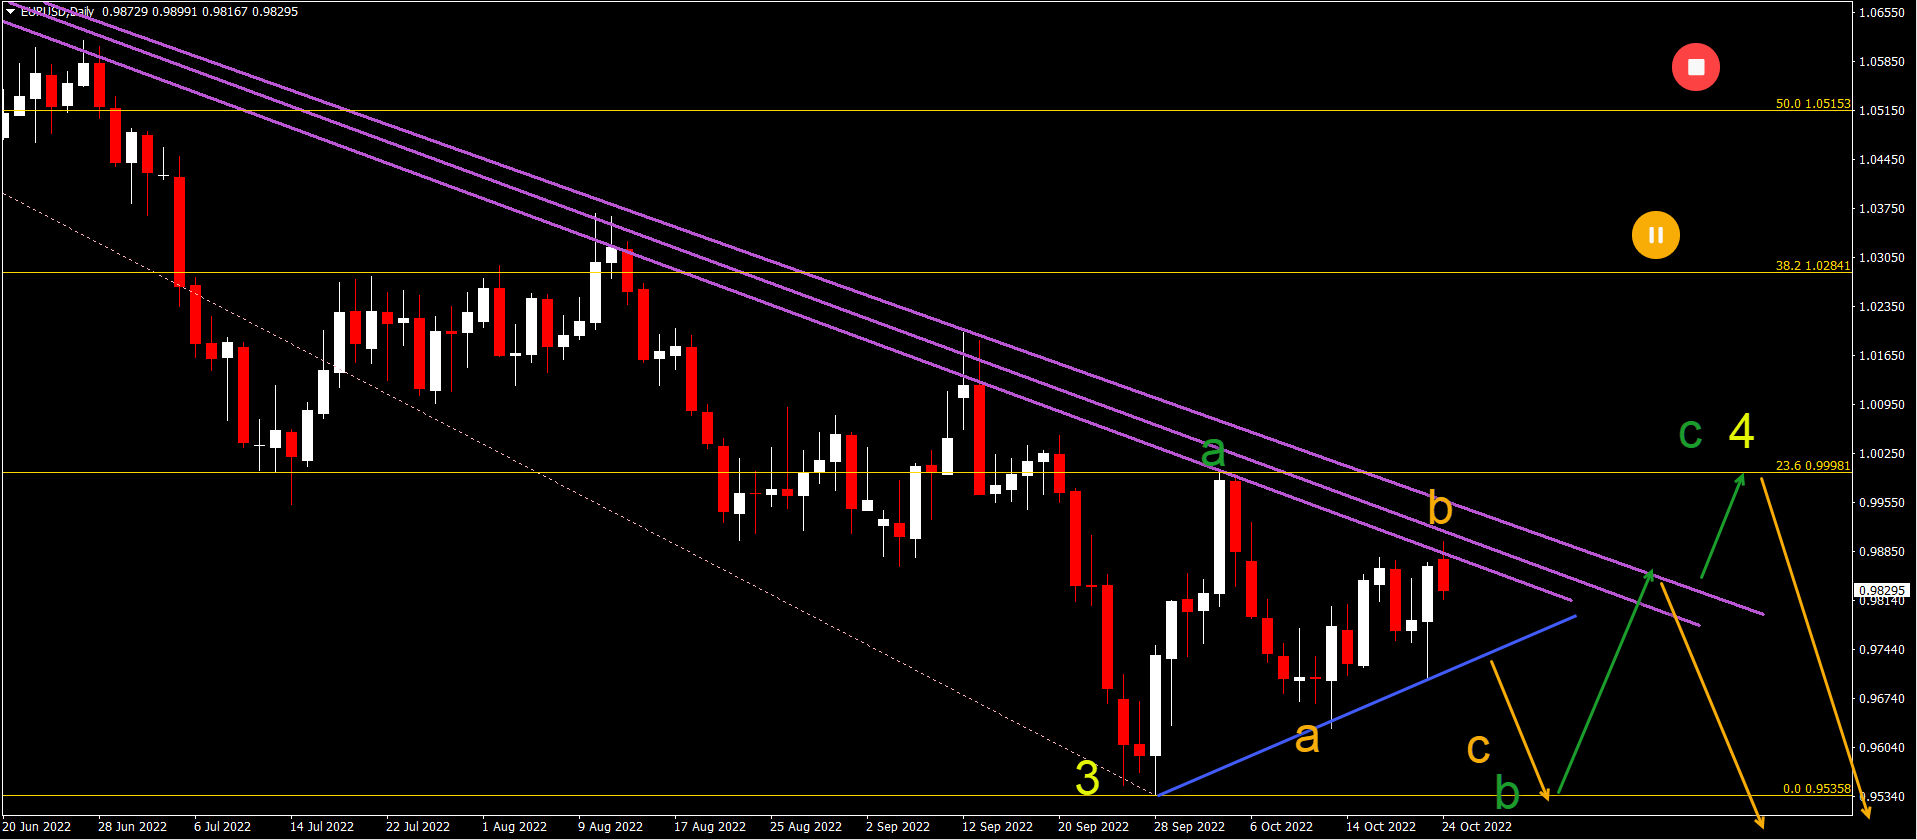
The EUR/USD remains trapped between the 0.95 support level and parity (1.00) resistance zone:

  1. The EUR/USD did make a bullish bounce (wave A orange) as expected.

  2. But the bullish rebound was milder than we anticipated. Therefore, we changed the expected Elliott Wave pattern to a bearish ABC (orange).

  3. Another bounce at the previous bottom near 0.95 could confirm the end of wave B (green) and the start of wave C (green).

  4. The wave C could end up as a bullish 5 wave pattern finishing at the previous top near the 23.6% Fibonacci level.

  5. A downtrend continuation is expected once the ABC (green) completes the wave 4 (yellow).

EURUSD

Bitcoin 

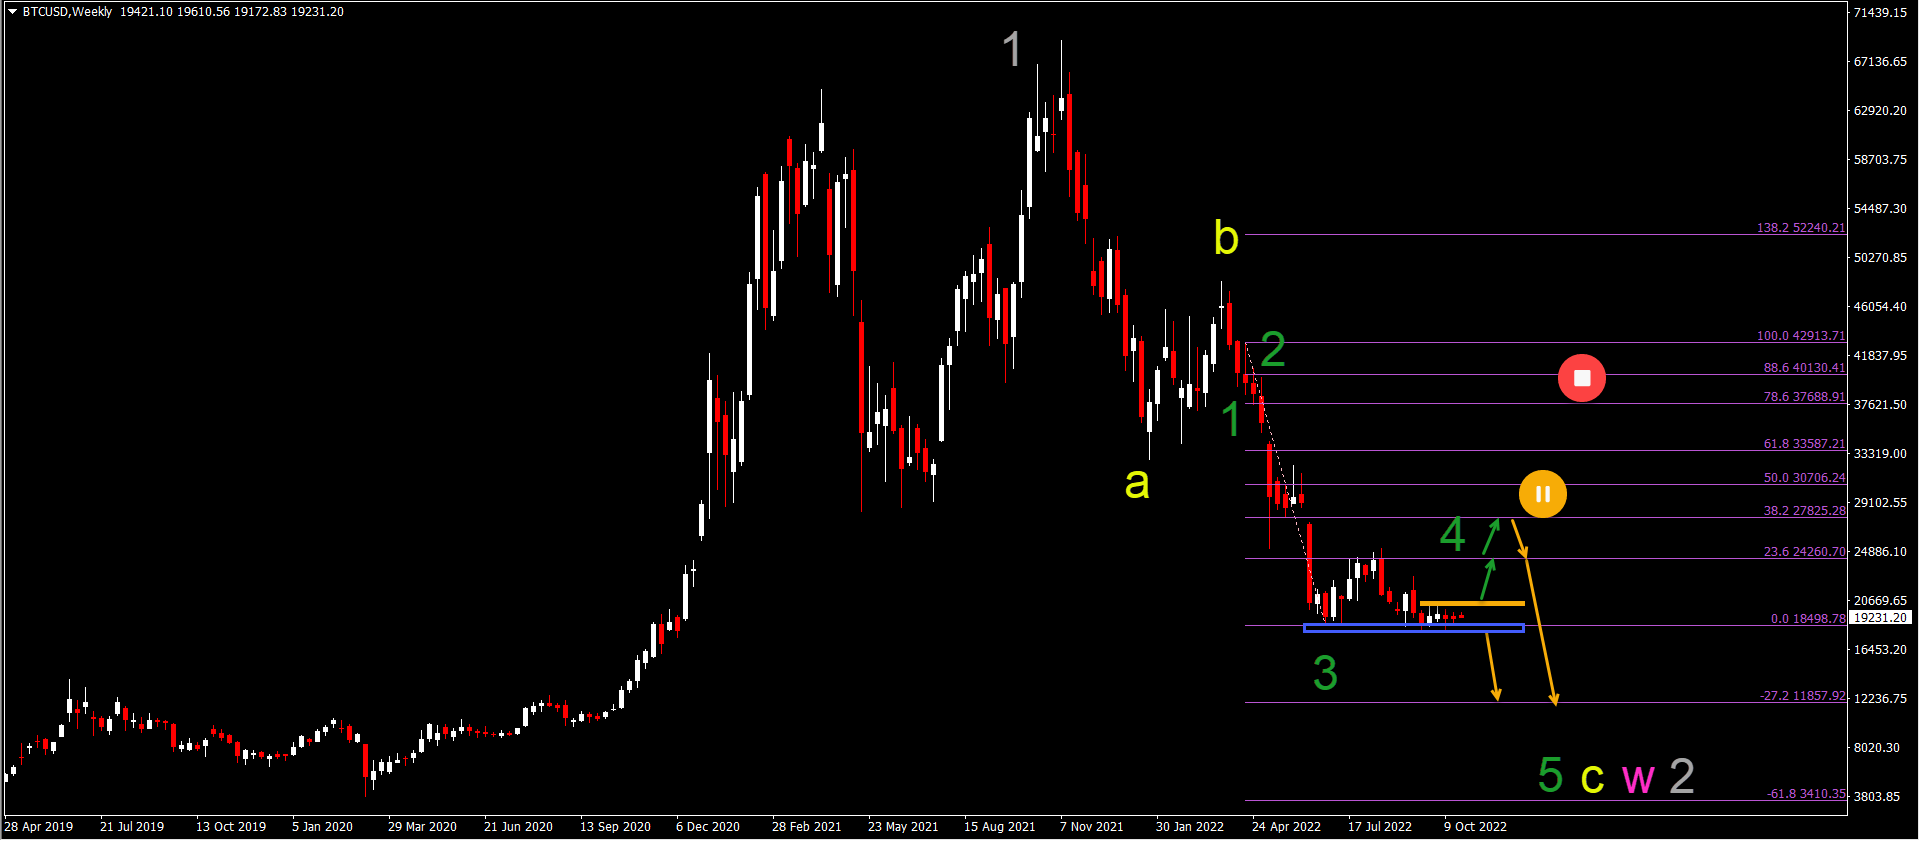
Bitcoin (BTC/USD is moving sideways between $19k and $20 resistance:

  1. BTC/USD is awaiting a break up or down. 

  2. A bearish breakout (orange arrow) below the support zone (blue) could confirm a drop towards the $15k and $12k support zones.

  3. A bullish breakout (orange arrows) above the $20 resistance zone (orange) could indicate a retracement towards the 23.6% and 38.2% Fibonacci levels.

  4. A deeper bullish push upwards places this bearish Elliott Wave analysis on hold.

  5. The bearish swing could complete a wave 5 (green) of wave C (yellow) of a wave W (pink) of wave 2 (gray).

Bitcoin

Natural gas strong bearish drop approaches $5 support

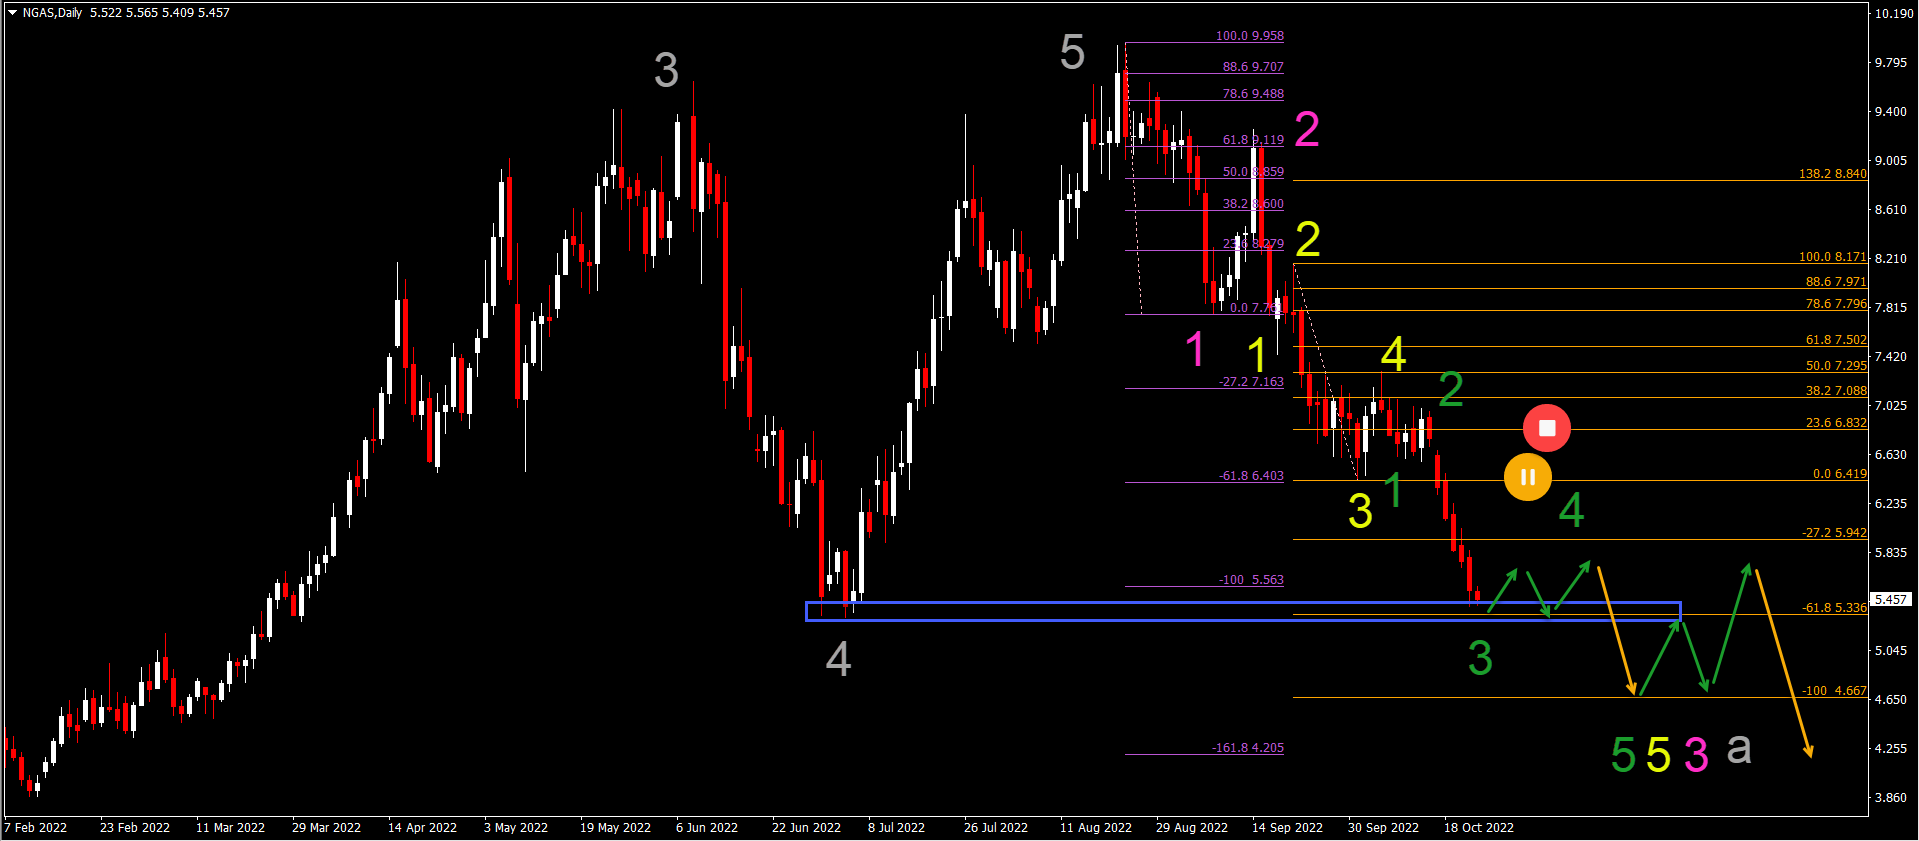
NGAS is dropping lower quickly as we anticipated last week:

  1. The bearish decline has been marked as a wave 3 (green).

  2. Price action could however stop at the support zone (blue) and make a bounce.

  3. A mild bullish correction marks the end of wave 3 (green) and the start of wave 4 (green).

  4. A bearish breakout (orange arrow) below the corrective pattern indicates a downtrend continuation towards the next Fibonacci target.

  5. This could complete wave 5 (green) of wave 5 (yellow) of wave 3 (pink) of A (gray).

  6. A deeper bullish retracement above $6.4 places this bearish Elliott Wave analysis on hold.

chart


The analysis has been done with the indicators and template from the SWAT method simple wave analysis and trading. For more daily technical and wave analysis and updates, sign-up to our newsletter

Elite CurrenSea Training Program(s) should not be treated as a recommendation or a suggestion to buy or sell any security or the suitability of any investment strategy for Student. The purchase, sale, or advice regarding any security, other financial instrument or system can only be performed by a licensed Industry representative; such as, but not limited to a Broker/Dealer, Introducing Broker, FCM and/or Registered Investment Advisor. Neither Elite CurrenSea nor its representatives are licensed to make such advisements. Electronic active trading (trading) may put your capital at risk, hence all trading decisions are made at your own risk. Furthermore, trading may also involve a high volume & frequency of trading activity. Each trade generates a commission and the total daily commission on such a high volume of trading can be considerable. Trading accounts should be considered speculative in nature with the objective being to generate short-term profits. This activity may result in the loss of more than 100% of an investment, which is the sole responsibility of the client. Any trader should realise the operation of a margin account under various market conditions and review his or her investment objectives, financial resources and risk tolerances to determine whether margin trading is appropriate for them. The increased leverage which margin provides may heighten risk substantially, including the risk of loss in excess of 100% of an investment.

Recommended Content


Recommended Content

Editors’ Picks

USD/JPY briefly recaptures 160.00, then pulls back sharply

USD/JPY briefly recaptures 160.00, then pulls back sharply

Having briefly recaptured 160.00, USD/JPY pulls back sharply toward 159.00 on potential Japanese FX intervention risks. The Yen tumbles amid news that Japan's PM lost 3 key seats in the by-election. Holiday-thinned trading exaggerates the USD/JPY price action. 

USD/JPY News

AUD/USD extends gains above 0.6550 on risk flows, hawkish RBA expectations

AUD/USD extends gains above 0.6550 on risk flows, hawkish RBA expectations

AUD/USD extends gains above 0.6550 in the Asian session on Monday. The Aussie pair is underpinned by increased bets of an RBA rate hike at its May policy meeting after the previous week's hot Australian CPI data. Risk flows also power the pair's upside. 

AUD/USD News

Gold stays weak below $2,350 amid risk-on mood, firmer USD

Gold stays weak below $2,350 amid risk-on mood, firmer USD

Gold price trades on a softer note below $2,350 early Monday. The recent US economic data showed that US inflationary pressures stayed firm, supporting the US Dollar at the expense of Gold price. The upbeat mood also adds to the weight on the bright metal.

Gold News

Ethereum fees drops to lowest level since October, ETH sustains above $3,200

Ethereum fees drops to lowest level since October, ETH sustains above $3,200

Ethereum’s high transaction fees has been a sticky issue for the blockchain in the past. This led to Layer 2 chains and scaling solutions developing alternatives for users looking to transact at a lower cost. 

Read more

Week ahead: Hawkish risk as Fed and NFP on tap, Eurozone data eyed too

Week ahead: Hawkish risk as Fed and NFP on tap, Eurozone data eyed too

Fed meets on Wednesday as US inflation stays elevated. Will Friday’s jobs report bring relief or more angst for the markets? Eurozone flash GDP and CPI numbers in focus for the Euro.

Read more

Majors

Cryptocurrencies

Signatures