Weekly technical market insight
Charts: Trading View
US Dollar Index (Daily Timeframe):
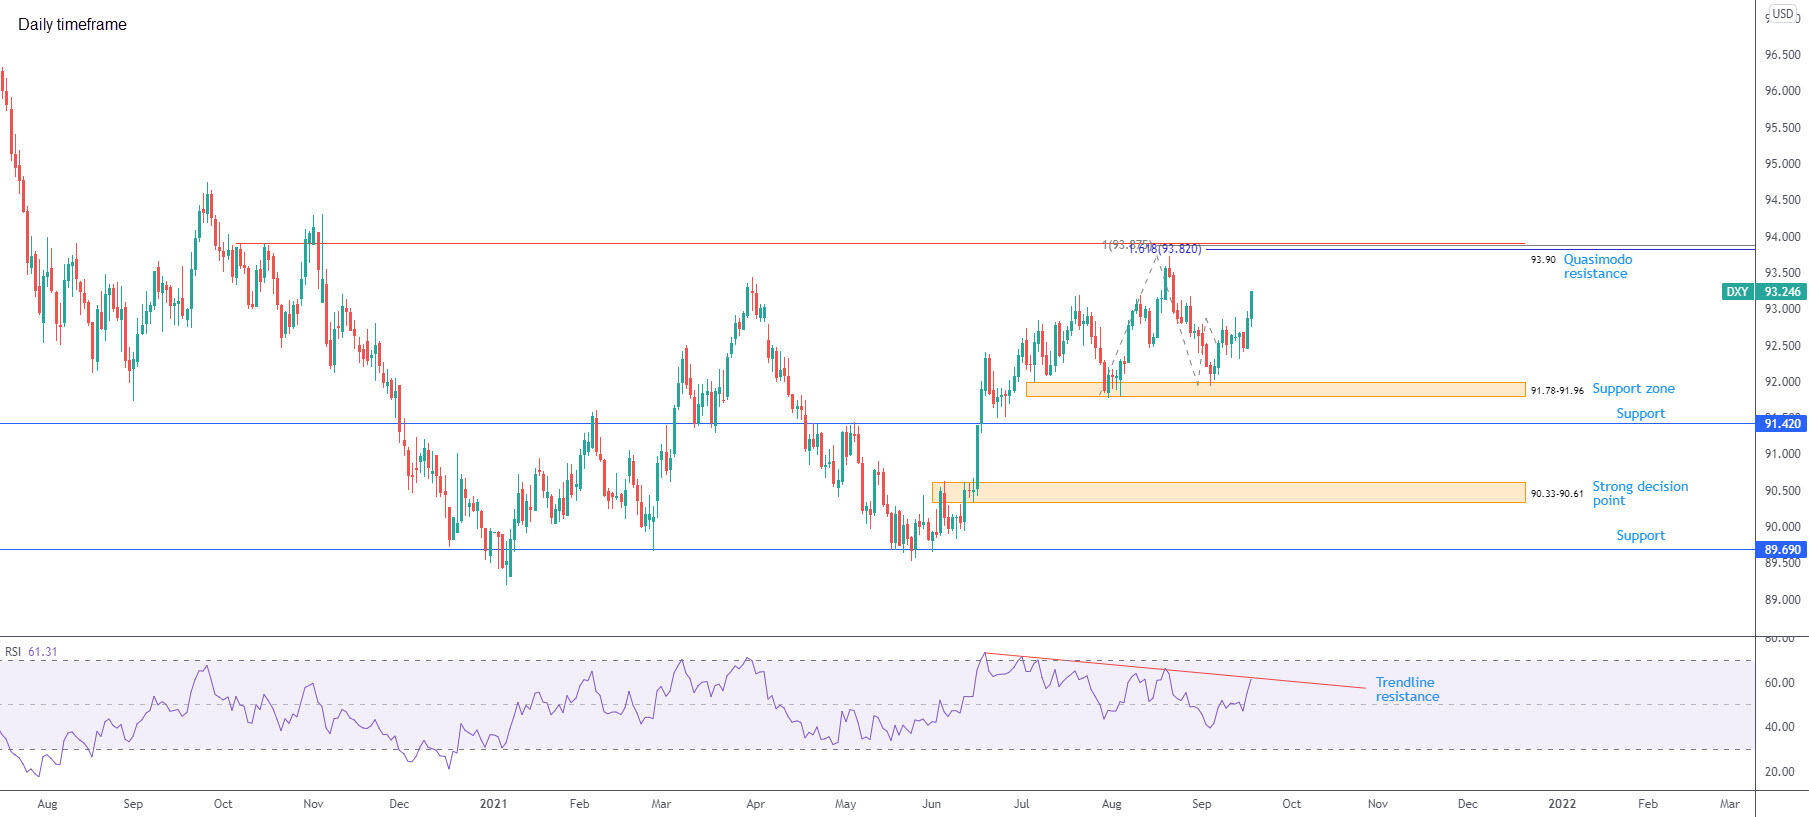
Deprived of prominent resistance, the US dollar pencilled in a second consecutive weekly gain, adding 0.5 percent according to the US dollar index.
Support from 91.78-91.96 has proved tenacious since the beginning of July, withstanding three successive downside attempts—the latest being early September. Dollar bulls, as you can see, entered an offensive phase at the tail end of the week. While it’d be unwise to rule out a retracement from current levels, Quasimodo resistance calls for attention at 93.90. Strategically placed north of the 93.73 August 20th high, and sharing space with 100% and 1.618% Fibonacci projections at 93.89 and 93.82, respectively, 93.90 may influence price movement should a test materialise.
With respect to trend, 2020 was disappointing, though 2021 has observed a defence form from support at 86.69 and, year on year, is 3.5 percent higher.
The relative strength index (RSI), a popular gauge of momentum, retested the 50.00 centreline over the week and is bound for trendline resistance (taken from the high 92.41), pinned a short distance below overbought territory.
- While chart studies, in particular the relative strength index, suggests upside momentum may flatten out, Quasimodo resistance at 93.90 delivers technical confluence traders may be drawn to this week. This, therefore, unwraps a possible USD bid early week and 93.90 test heading into the close.
EUR/USD:
(Italics: previous analysis)
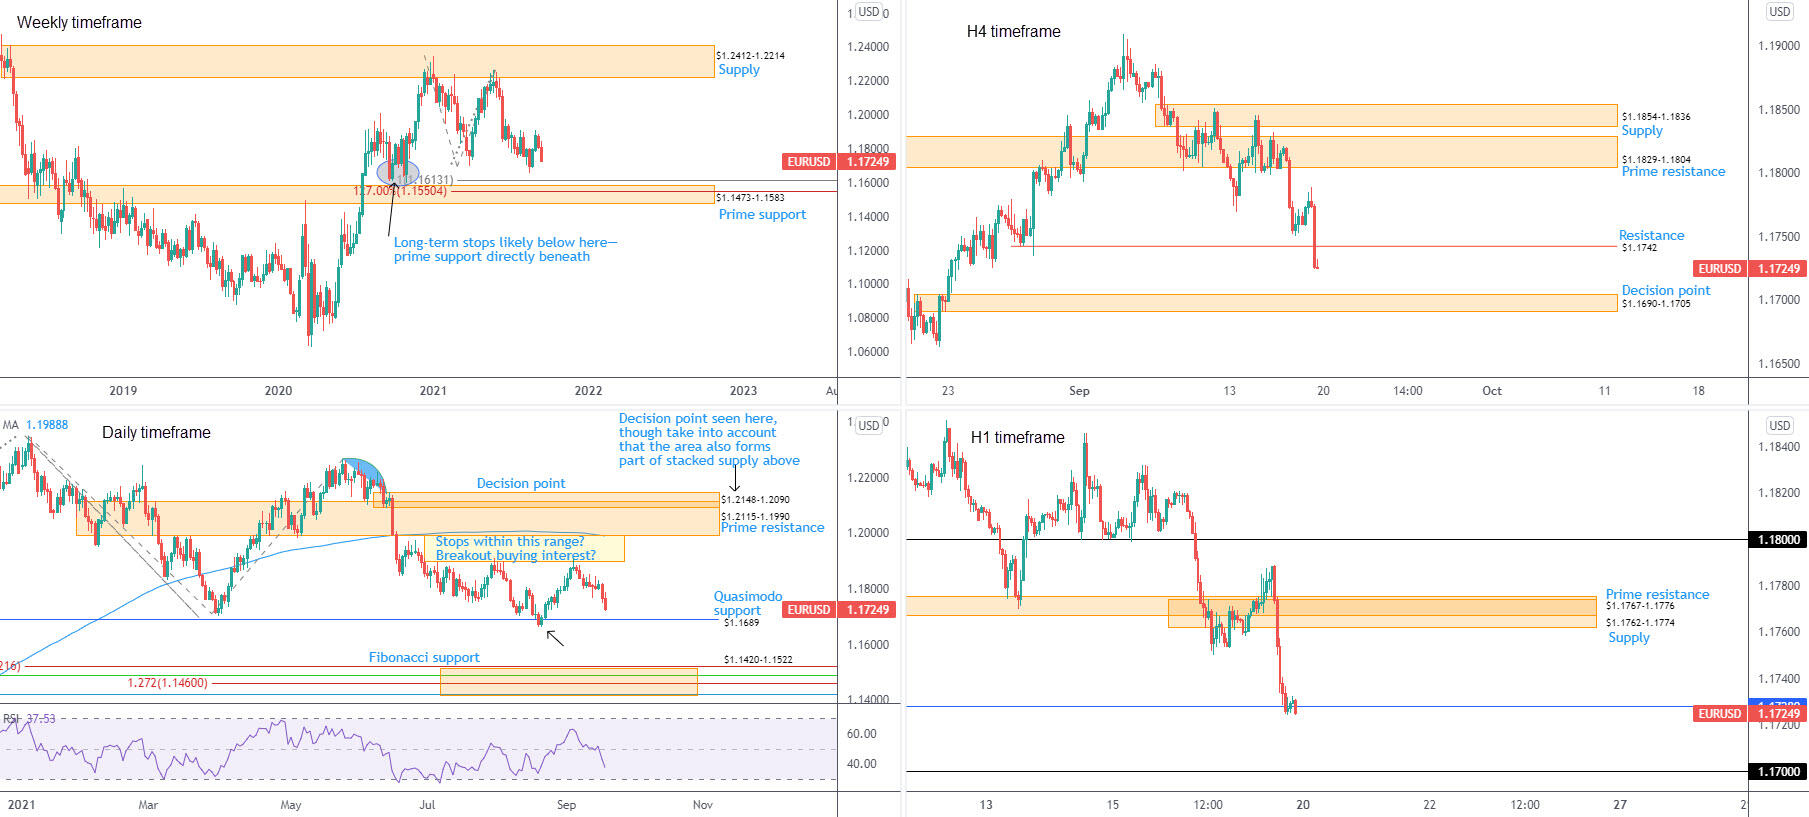
Europe’s common currency shed 0.7 percent versus a broadly healthier US dollar last week, seating price action within touching distance of prime support on the weekly timeframe at $1.1473-1.1583. Fibonacci enthusiasts will note a 100% Fib projection at $1.1613 and 1.27% Fib extension at $1.1550 circling the upper range of the aforesaid support. Interestingly, long-term stops likely rest south of the $1.1640ish lows and perhaps accommodate enough energy to fill $1.1473-1.1583 bids. With respect to trend on the weekly chart, we can see the market has largely been higher since the early months of 2020.
The second half of the week accelerated to the downside, throwing light on Quasimodo support at $1.1689. Albeit sponsoring a late August bid, subsequent action failing to find acceptance north of late July tops at $1.1909 ranks $1.1689 as perhaps frail support this week. Assuming a bearish leadership this week, the $1.1615 and $1.1602 (September/November 2020) lows might entice bids, followed by Fibonacci support between $1.1420 and $1.1522 (glued to the lower side of the weekly timeframe’s prime support at $1.1473-1.1583).
Against the backdrop of higher timeframes, price action on the H4 chart passed through Quasimodo support at $1.1742 in strong fashion Friday. $1.1742 likely to serve as resistance going forward, the $1.1690-1.1705 decision point putting in an appearance should not surprise. Statistically, decision points left untested following the immediate move out of the base offer uncertain structure. $1.1690-1.1705 also teams up closely with daily Quasimodo support mentioned above at $1.1689, which you may recall chart studies have labelled fragile
Through the lens of a simple technical trader, limited support is evident on the H1 scale until $1.17 (sat within the walls of the H4 timeframe’s decision point at $1.1690-1.1705. Stacked demand is present between $1.1706 and $1.1744 (23rd August), with little revealing that active buyers will show interest. For that reason, $1.17 is a key downside objective this week. However, buyers entertaining the idea of bouncing from the August 24th lows around $1.1728 shines the spotlight on a pullback to prime resistance coming in at $1.1767-1.1776, joined by supply at $1.1762-1.1774.
Observed Levels:
Long term:
Weekly prime support at $1.1473-1.1583, coupled with a 100% Fib projection at $1.1613 and 1.27% Fib extension at $1.1550, might welcome price action this week. As underlined above, it’s in a reasonably privileged location: below the $1.1640ish lows. Overturning daily Quasimodo support at $1.1689, therefore, is a possible scenario, targeting daily Fibonacci support at $1.1420-1.1522.
Short term:
In conjunction with the longer-term picture, a bearish energy is present on the lower timeframes this week. The combination of $1.17 on the H1 and its surrounding decision point on the H4 at $1.1690-1.1705 offers a downside target. Any pullback would likely be viewed as a sell-on-rally scenario, either from H4 resistance at $1.1742 (previous Quasimodo support) or H1 prime resistance at $1.1767-1.1776 (and supply at $1.1762-1.1774).
AUD/USD:
(Italics: previous analysis)
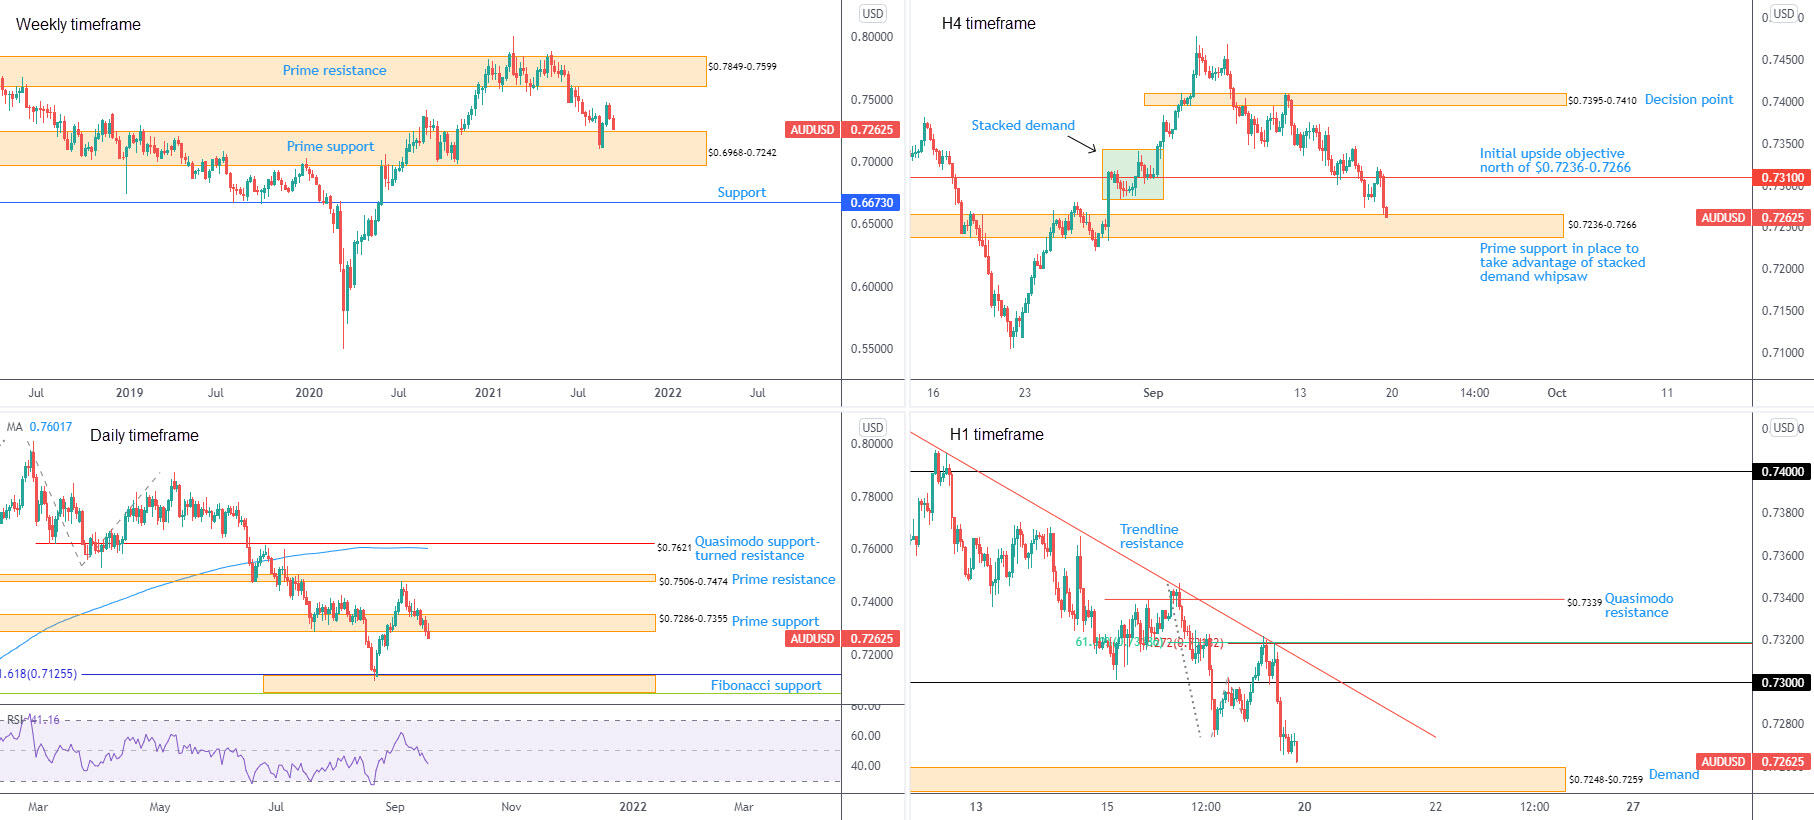
Prime support at $0.6968-0.7242 on the weekly timeframe has been fighting to entice fresh bullish interest since the area powered a two-week recovery. Failure to command position from $0.6968-0.7242 opens up support at $0.6673. Buyers regaining consciousness, nevertheless, has prime resistance at $0.7849-0.7599 to target. Trend studies show we’ve been higher since early 2020. Consequently, the response from $0.6968-0.7242 could STILL be the beginnings of a dip-buying attempt to merge with the current trend.
The daily timeframe scraping through prime support at $0.7286-0.7355 broadcasts weakness this week. Recognising this delivers free rein to move towards Fibonacci support at $0.7057-0.7126, which is set within the parapets of weekly prime support at $0.6968-0.7242. With the relative strength index (RSI) cementing position below the 50.00 centreline—telling traders that average losses over the 14-day lookback period surpass average gains—this adds weight to a bearish vibe.
Although the higher timeframe canvas favours sellers, the H4 timeframe touched gloves with prime support at $0.7236-0.7266 (glued to the upper edge of weekly prime support at $0.6968-0.7242). You may recall this area was made reference to throughout the week—see below from previous writing (italics):
Sellers assuming leadership yesterday hauled the currency pair through stacked demand on the H4 timeframe between $0.7282 and $0.7343, dropping to within a stone’s throw from prime support at $0.7236-0.7266. The latter may interest bullish eyes—a base arranged to receive downside momentum derived from sell-stops below stacked demand.
Recognising $0.7236-0.7266 welcoming price action late Friday, $0.7310 stands in as an initial target early week should buyers stage a recovery.
Meanwhile, out of the H1 chart, early London on Friday responded to trendline resistance, extended from the high $0.7469, hardened by the 61.8% Fibonacci retracement at $0.7319 and a 1.272% Fibonacci projection at similar levels. This led movement south of $0.73 heading into US trading hours and within reach of $0.7248-$0.7259 demand (a zone placed within H4 prime support at $0.7236-0.7266).
Observed Levels:
Long term:
Weekly prime support at $0.6968-0.7242 is a key base on the bigger picture, though having noted the daily timeframe’s prime support is in the process of giving up position at $0.7286-0.7355, a deep dive into the aforementioned weekly zone is a possibility.
Short term:
Focus is on the H4 timeframe’s prime support at $0.7236-0.7266, as buyers potentially gear up to take advantage of selling pressure (sell-stops) south of stacked demand. As underlined above, the initial upside objection north of $0.7236-0.7266 sits at $0.7310.
$0.7248-$0.7259 demand on the H1, therefore, could be brought into the fight before a short-term bid arises.
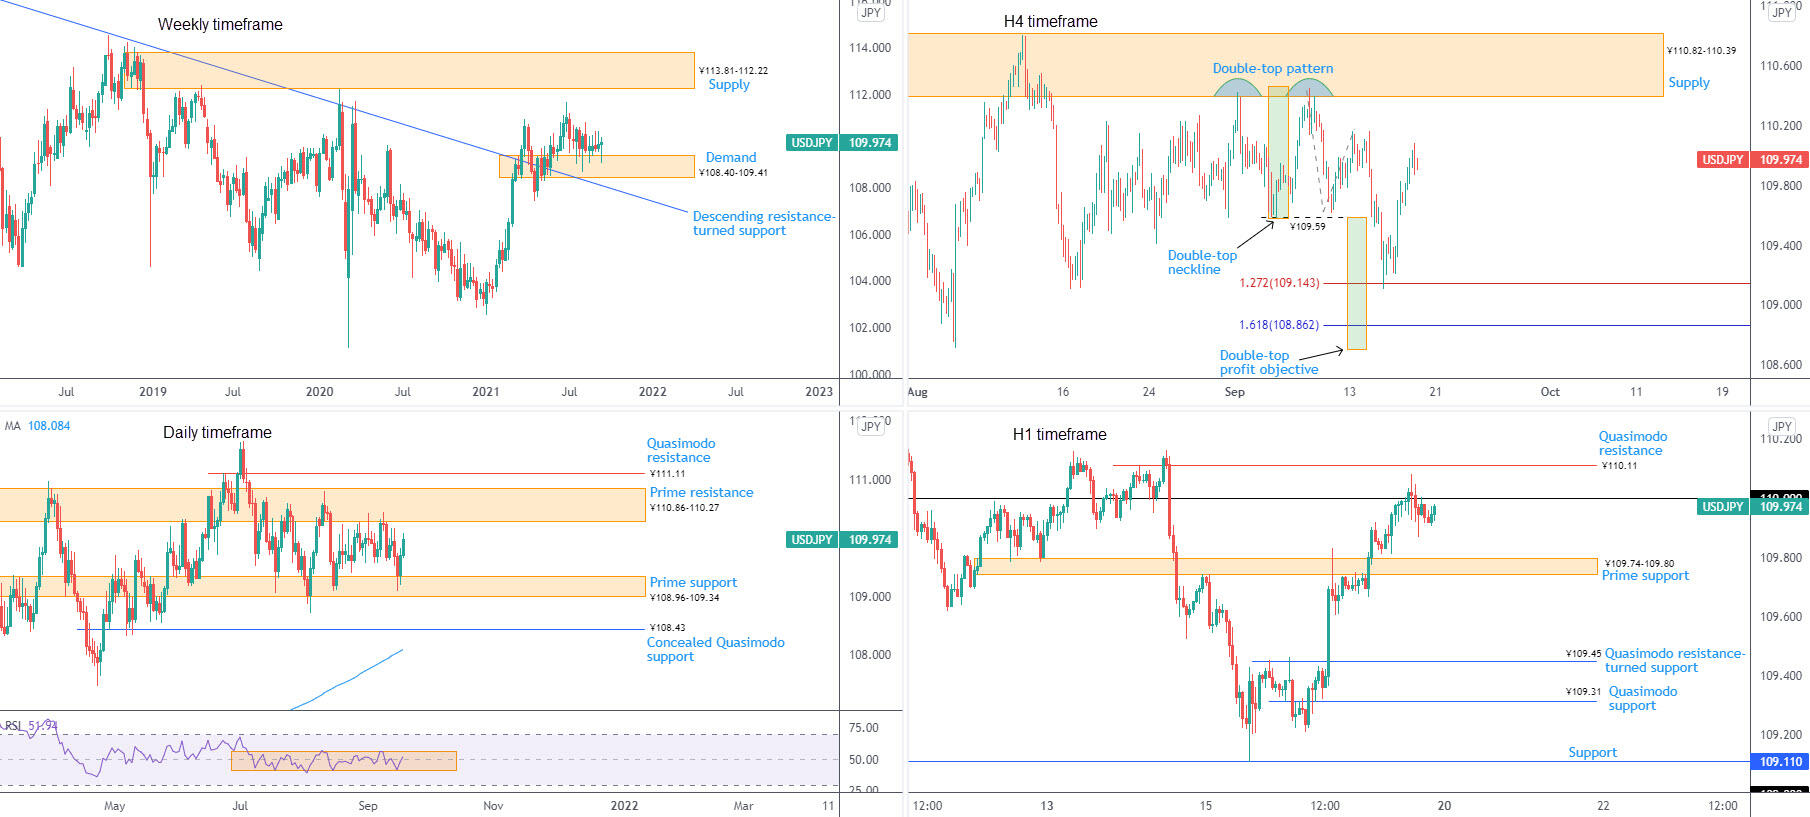
USD/JPY:
(Italics: previous analysis)
Since mid-July, ¥108.40-109.41 demand has failed to stir much bullish energy on the weekly timeframe. Nevertheless, recognising the area derives additional backing from neighbouring descending resistance-turned support, extended from the high ¥118.61, an advance could eventually emerge to familiar supply at ¥113.81-112.22.
The uninspiring vibe out of weekly demand is demonstrated by way of a clear-cut consolidation on the daily timeframe between prime support at ¥108.96-109.34 and resistance from ¥110.86-110.27. The reluctance to commit outside of these areas toughens the consolidation; range limits, therefore, are likely to remain on the watchlist this week.
A robust pickup in USD demand elevated USD/JPY on Thursday, pulling back to highs of ¥109.83. Overall, however, chart studies indicate a bearish vibe following the breach of a double-top pattern’s (¥110.44) neckline, drawn from ¥109.59. The pattern’s target sits around ¥108.71, plotted alongside a 1.618% Fibonacci projection at ¥108.86. Continued interest to the upside, nonetheless, is likely to close in on supply at ¥110.82-110.39—the base entertaining the noted double-top configuration.
From the H1 timeframe, a ¥109.84-109.79 decision point elbowed into the spotlight going into US trading on Thursday, prompting a shooting star candlestick pattern (frequently viewed as a bearish signal). Air space above the aforementioned zone channels focus towards the ¥110 figure, closely shadowed by prime resistance at ¥110.15-110.12. To the downside from current levels, Quasimodo resistance-turned support is seen at ¥109.45, followed closely by Quasimodo support at ¥109.31.
Observed Levels:
Long term:
Short term:
Recognising weekly demand in play at ¥108.40-109.41, joined by range support on the daily timeframe at ¥108.96-109.34, signals the H1 decision point at ¥109.84-109.79 is perhaps fragile and could lead to ¥110 making a show today.
Another option, of course, prior to reaching for higher levels, is a retracement to bring in buyers off either H1 Quasimodo resistance-turned support at ¥109.45, or Quasimodo support at ¥109.31.
GBP/USD:
(Italics: previous analysis)
In the shape of a hammer candlestick formation (bullish signal), supply-turned demand at $1.3629-1.3456 on the weekly timeframe stepped forward in July. The aforementioned zone remains active, welcoming an additional test mid-August. Yet, pattern traders will also note August’s move closed south of a double-top pattern’s neckline at $1.3664, broadcasting a bearish vibe. Conservative pattern sellers, however, are likely to pursue a candle close beneath $1.3629-1.3456 before pulling the trigger.
Britain’s pound journeyed south versus a stronger US dollar Thursday, pressured following August’s optimistic US retail sales figures. This helped reinforce a bearish setting beneath the 200-day simple moving average at $1.3828. This raises the possibility of further underperformance to Quasimodo support at $1.3609.
It was also aired in recent writing that the daily chart communicates a rangebound environment. Since late June, buyers and sellers have been squaring off between a 61.8% Fib retracement at $1.3991 and the noted Quasimodo support. Directly above the consolidation, two tight-knit 100% Fib projections are seen around $1.4017—a double AB=CD bearish configuration for any harmonic traders. Momentum studies, according to the relative strength index (RSI), made its way above the 50.00 centreline early September and retested the barrier (average gains exceed average losses).
H4 prime resistance at $1.3940-1.3888 has proved a stubborn area. Sellers have since strengthened their grip and has price fast approaching prime support at $1.3689-1.3724. This area may interest those looking at price taking out stops beneath lows around $1.3730 (blue oval).
Elsewhere. Short-term action based on the H1 chart has the pair circling the lower side of $1.38, as we write. Interestingly, supply at $1.3837-1.3812 lurks directly overhead and could help facilitate what many traders will recognise as a stop-run after the event. Chart space below $1.38 shifts attention to Quasimodo support from $1.3751.
Observed Levels:
Long term:
Short term:
Technical studies from the H4 timeframe suggests bears are likely to remain in the driving seat for the time being, at least until we touch gloves with prime support at $1.3689-1.3724. Prior to any downside move, H1 sellers may welcome a whipsaw north of $1.38 to supply at $1.3837-1.3812. Conservative sellers out of the aforesaid supply will perhaps wait for a DECISIVE H1 close to form beneath $1.38 before committing, targeting H1 Quasimodo support at $1.3751 and the upper edge of H4 prime support from $1.3724.
Author

Aaron Hill
FP Markets
After completing his Bachelor’s degree in English and Creative Writing in the UK, and subsequently spending a handful of years teaching English as a foreign language teacher around Asia, Aaron was introduced to financial trading,


