Wall Street Week Ahead (SPX, SPY, QQQ): Fed balance sheet hits record high and equities follow suit
- Reddit army returns on Friday as meme stocks bounce.
- Inflation is firmly put to bed as yields dump.
- Record highs for indices as TINA (There Is No Alternative) trade carries on.

Another week another record high for stocks as equity markets power on. The theme of 2021 is back on track as yet another record high strengthens the series of records that 2021 has so far chalked up. The week started meekly with traders unsure what the inflation genie had in store for them with Thursday's Consumer Price Index (CPI) data. The inflation genie has been out of the lamp for some time but the Fed seems to have gotten its three wishes of transitory, transitory, transitory. Actually, market participants seem to have accepted the fact that inflation is not going to be transitory but have taken some solace from the Fed also coming to this conclusion. As we have mentioned before, the biggest test in Fed policy history is likely to show in 2022. It will be interesting to see how the Fed tapers the biggest money printing scheme in modern economic history and begin to raise rates, without causing a market meltdown.
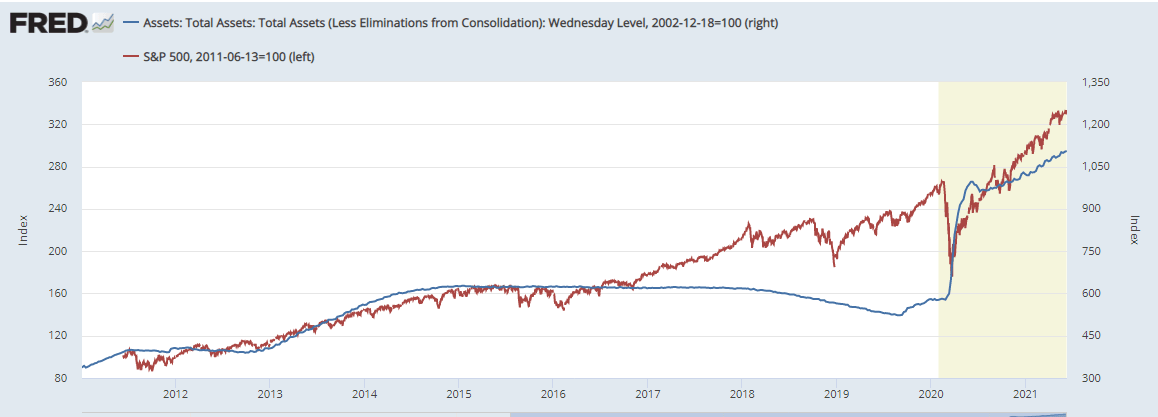
As it stands, the Fed continues to print and increase its balance sheet so the equity market has nothing else to do but follow suit. A feat it has managed admirably since the Fed started its money-printing and bond purchasing plan post the financial crisis in 2009. The chart below shows a correlation between Fed's balance sheet and S&P 500.
US Consumer Price Inflation woke markets from their slumber on Thursday with a surprising, but not too surprising, increase past expectations. This was brushed aside by investors who appear to have inflation fatigue. The main equity index futures S&P, Nasdaq, and Dow all dropped on the release but quickly bounced and went on to register record highs for the cash and futures contracts. Volatility continues to decline with the VIX dropping to below 16 and yields went back to sleep despite inflation hitting multi-year highs. The 10-year yield continues to fall, hitting 1.45% on Friday.
Meme stocks took a breather at the start of the week as retail traders turned somewhat cautious after last week's stellar performances. As the week wore on the lack of any kickback from the embattled short community saw retail bulls return to send some of the new and old favourites noticeably higher. Talk of a massive battle over the $50 AMC call expiring on Friday saw some decent volume and volatility in AMC on Thursday and Friday.
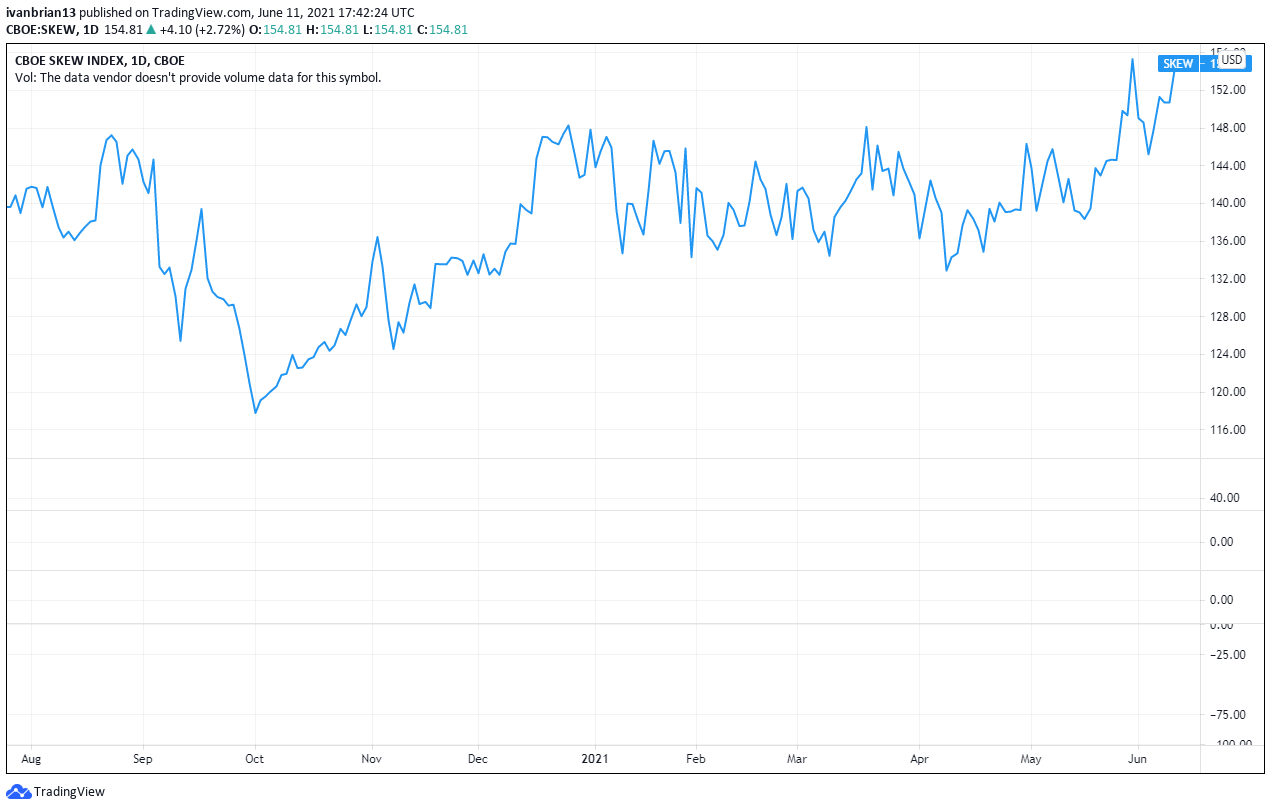
While the equity indices continue to grudgingly push higher many are either on the sidelines or actively seeking safety. The latest Refinitiv LipperAlpha flow data shows the S&P 500 ETF (SPY) losing nearly $2 billion in redemptions in the week to June 9. Conventional equity funds, those that are non ETF's also saw net redemptions to June 9, with nearly $3 billion being withdrawn from said equity funds. The latest SKEW data from the Chicago Board Options Exchange (CBOE) shows put buying on the equity indices close to record highs as investors look for downside protection or profit potential. Meanwhile, the market marches onwards and upwards.
Results season has been over for the last 2 to 3 weeks but we could not let the week pass without mentioning GameStop (GME). The Reddit darling that started it all released results on Thursday. Earnings per share (EPS) beat estimates coming in at -$0.45 versus -$0.82 estimate. GME announced a new CEO, Matt Furlong formerly of Amazon (AMZN).
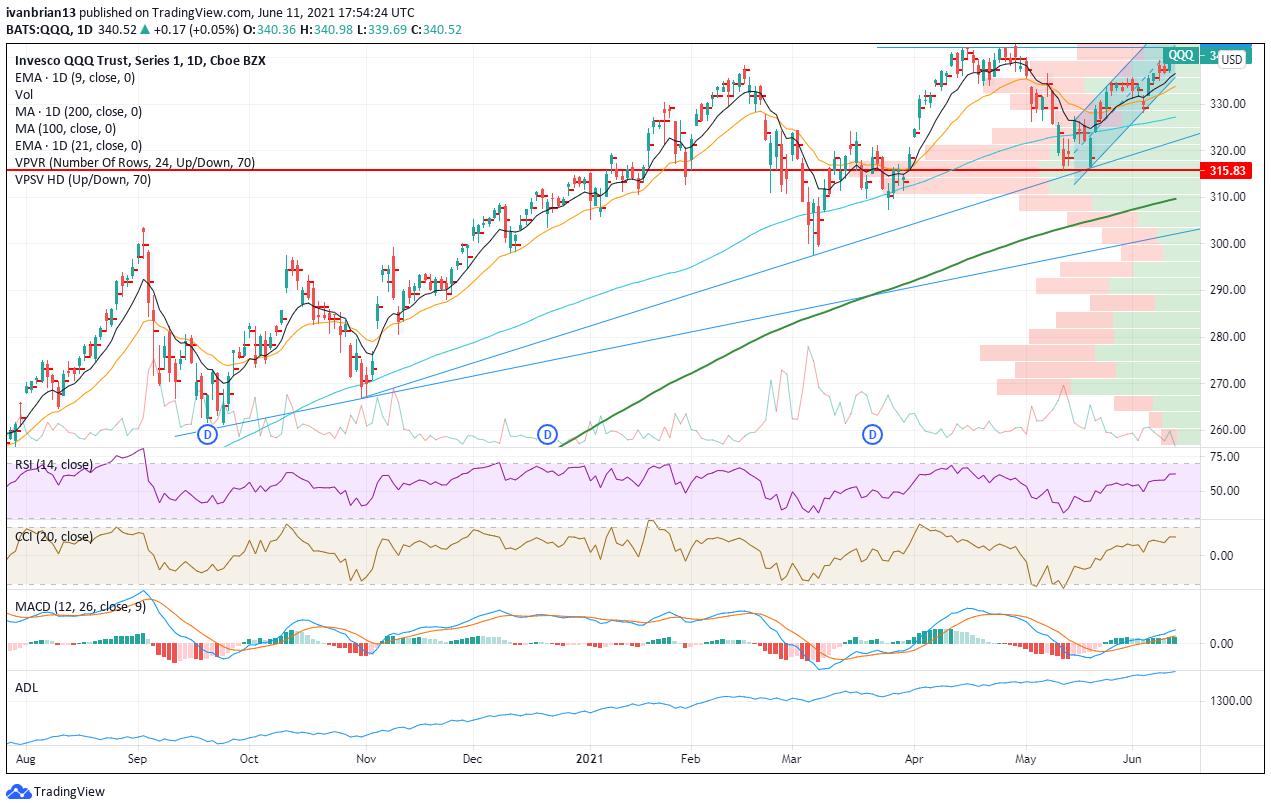
Nasdaq (QQQ) technical analysis
Let's take a look at our friend the Q's, Nasdaq ETF (QQQ). The double bottom at 315.83 is the point of control since August, demonstrating just how strong a level this was. The 9-day moving average and uptrend channel are working nicely to guide the Nasdaq higher as it plays catch up with the S&P. A nice uptrend channel continues to be adhered to as shown below. Support at 334.88 from the lower channel can be seen, as well as from 321.72, the longer-term trend line. The trend line below that traces from the October 2020 low gives support at 302.45. Of course, the market will not trade there anytime soon unless we get the fun of a flash crash again.
Wall Street Week Ahead
Earnings from Oracle on Tuesday and Adobe on Thursday are the tech highlights. Kroger also reports on Thursday. The supermarket chain is expected to post earnings per share of $1 on revenues of $39.6 billion.
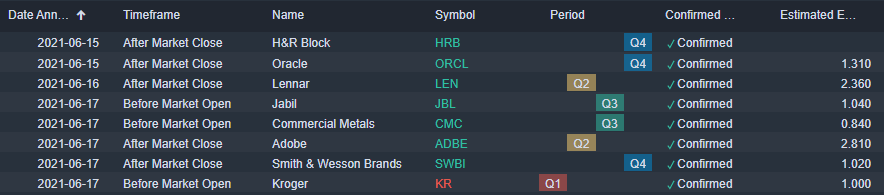
Source: Benzinga Pro
Economic releases
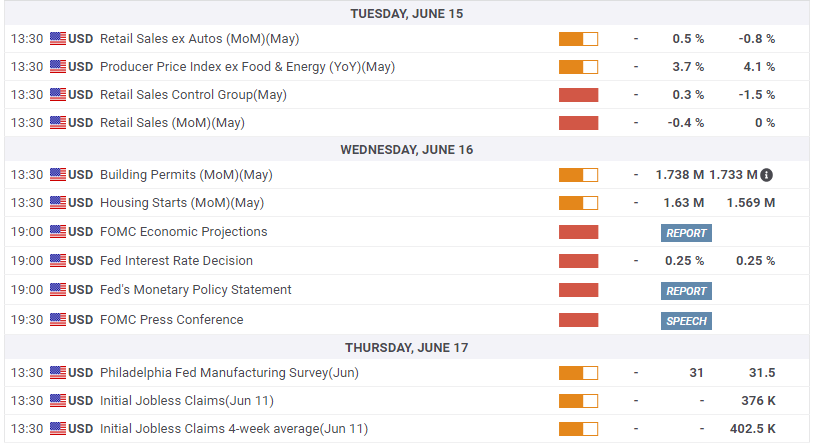
The week kicks off on Tuesday for data hounds as Producer Price Index (PPI) and Retail Sales hit the tape which will provide some interest. PPI may be losing relevance after this week's spike in CPI so it would really take something for PPI to surprise. Retail sales do have some potential to shock as the reopening trade is dependant on the number showing continuing strength. Risk aversion will probably be in vogue until the Fed interest rate decision. Well, we know the decision but the minutes and press conference may provide more colour on the inflation backdrop and Fed tapering plans, assuming they have some! That is really as good as it gets on the data front next week with weekly jobless claims on Thursday now a virtual non-event and Friday seeing little data apart from CFTC commitment of traders.
Author

Ivan Brian
FXStreet
Ivan Brian started his career with AIB Bank in corporate finance and then worked for seven years at Baxter. He started as a macro analyst before becoming Head of Research and then CFO.


