USOIL: There will be no glut!

All of you movie buffs out there probably immediately understood the reference in the title to the movie "There will be blood". Without getting into too much film trivia here, the story revolves around the early days of the crude oil industry, and today's analysis focuses on the latest developments concerning the price of crude oil futures.
The price of the commodity enjoyed a remarkable rally recently, as fears over muted global demand were promptly replaced by heightened investors' enthusiasm following the latest vaccine news and developments at Washington. The market is riding high on its expectations for the future, which is distorting the general demand for safe-haven assets in favour of oil and the greenback.
For as long as demand for crude remains so high, the risk for a new supply glut remains comparatively low. The current bullish sentiment is undeniably strong, and the price of oil is expected to continue climbing in the following weeks, which is substantiated by most underlying fundamentals.
Therefore, traders who would like to capitalise on this market setup would have to look for the next opportunity to join the existing trend, preferably following a bearish correction. That is why the purpose of today's analysis is to examine the best possible scenario for the implementation of such trend-continuation trading strategies.
1. Long-Term Outlook:
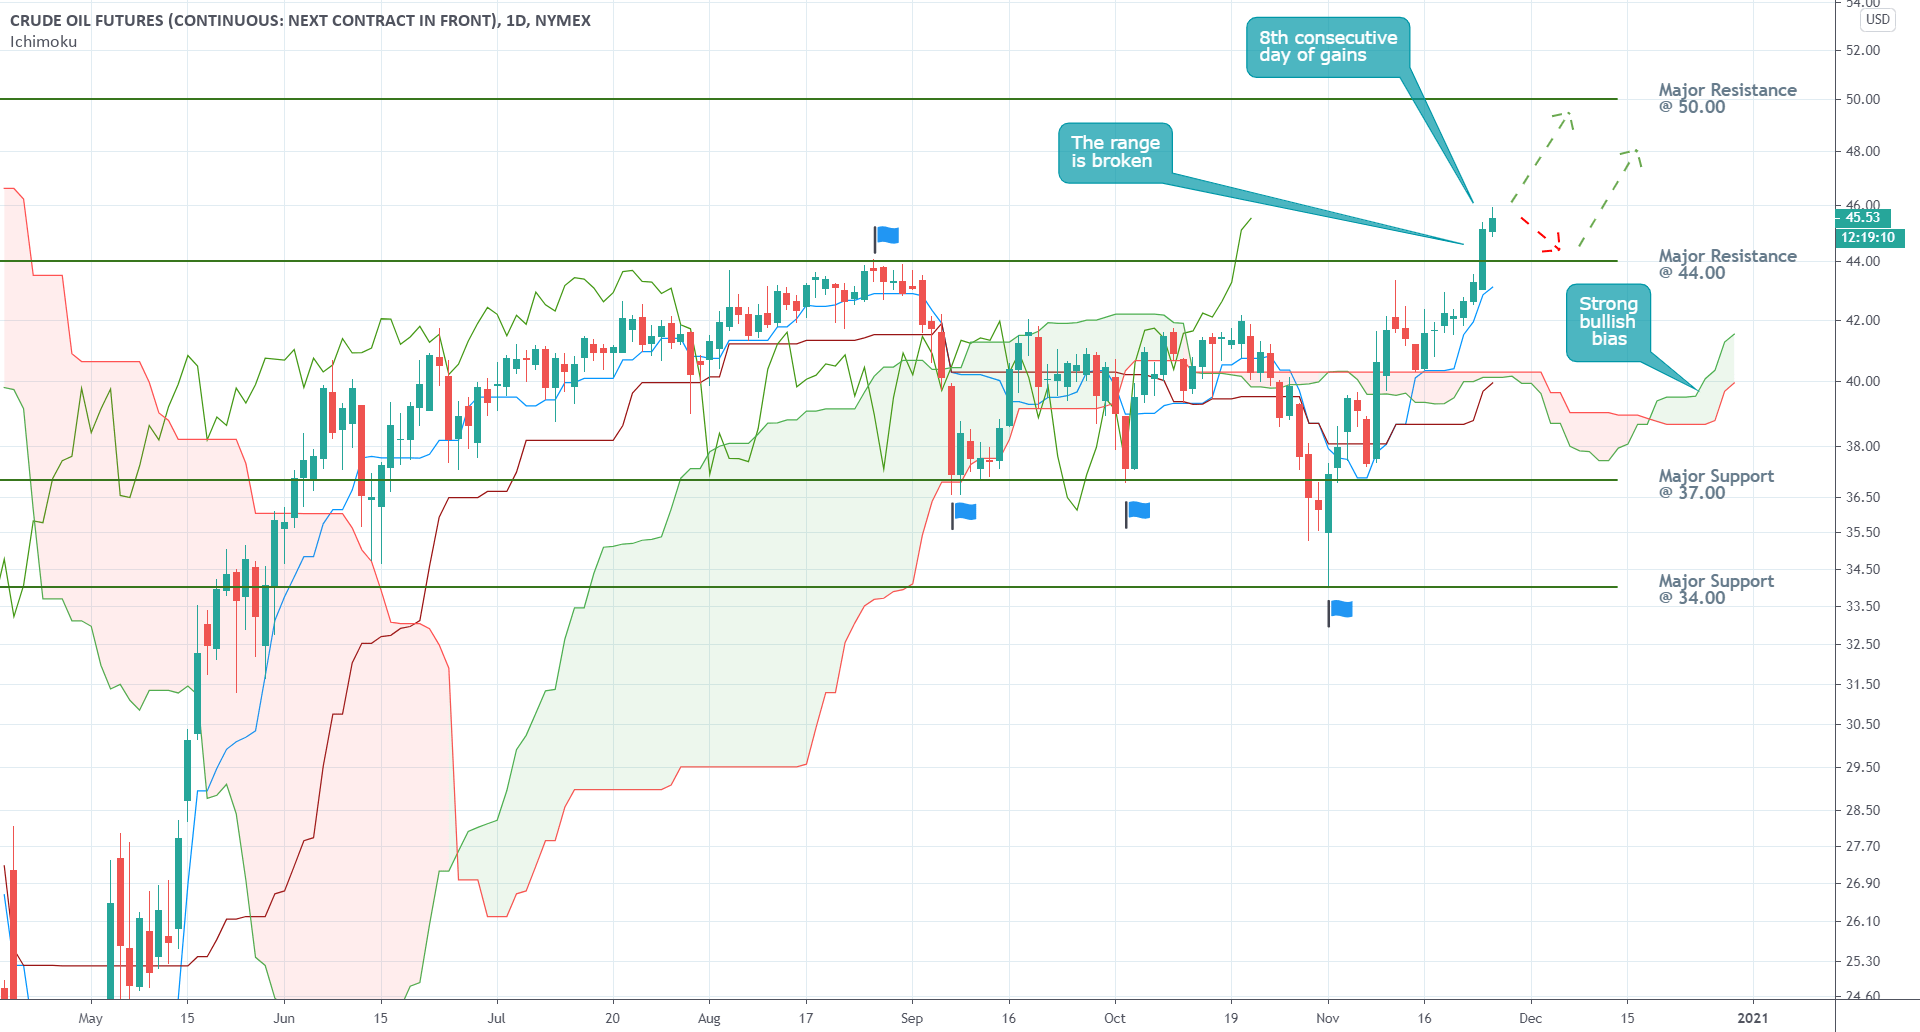
First of all, the transition of the market from the previous range-trading environment into a new bullish-trending one has to be confirmed. As can be seen on the daily chart below, the price action had been range-trading between the major resistance level at 44.00 and the major support level at 37.00 since mid-June – the flags highlight the more prominent rebounds from one of the two extremes of the range. Yesterday's major breakout above 44.00 represents the first substantial attempt at the formation of a new bullish trend.
The Ichimoku Cloud indicator is applied to evaluate the changing market bias. Yesterday's breakout above the range's upper boundary prompted the emergence of renewed bullish bias (this is ascertained from the changing cloud). Hence, the indicator confirms the primary expectations for continued price appreciation in the near term. However, several factors warrant closer consideration here.
Throwbacks to the resistance typically follow such major breakouts, the first of their kind, from a substantial and long-lasting range. These throwbacks (retracements) test the price level's new role as a support. In this particular case, traders should prepare for a potential retracement to 44.00 in the very near future, before the currently developing uptrend can be continued.
Notice also that the price action has been climbing steadily for the last seven days – each subsequent candle has closed higher than its opening price. Yesterday's candle, being seventh in line, represents a crucial benchmark – traders would increasingly recognise the need for a bearish correction. Hence, there are even more reasons justifying the expectations for a temporary pullback, which would allow traders to join the market at the resulting dip.
The main goal for the evolving bullish trend is the major resistance at 50.00. It bears significant psychological importance, so traders should be especially mindful of the behaviour of the price action close to this psychological barrier.
2. Short-Term Outlook:
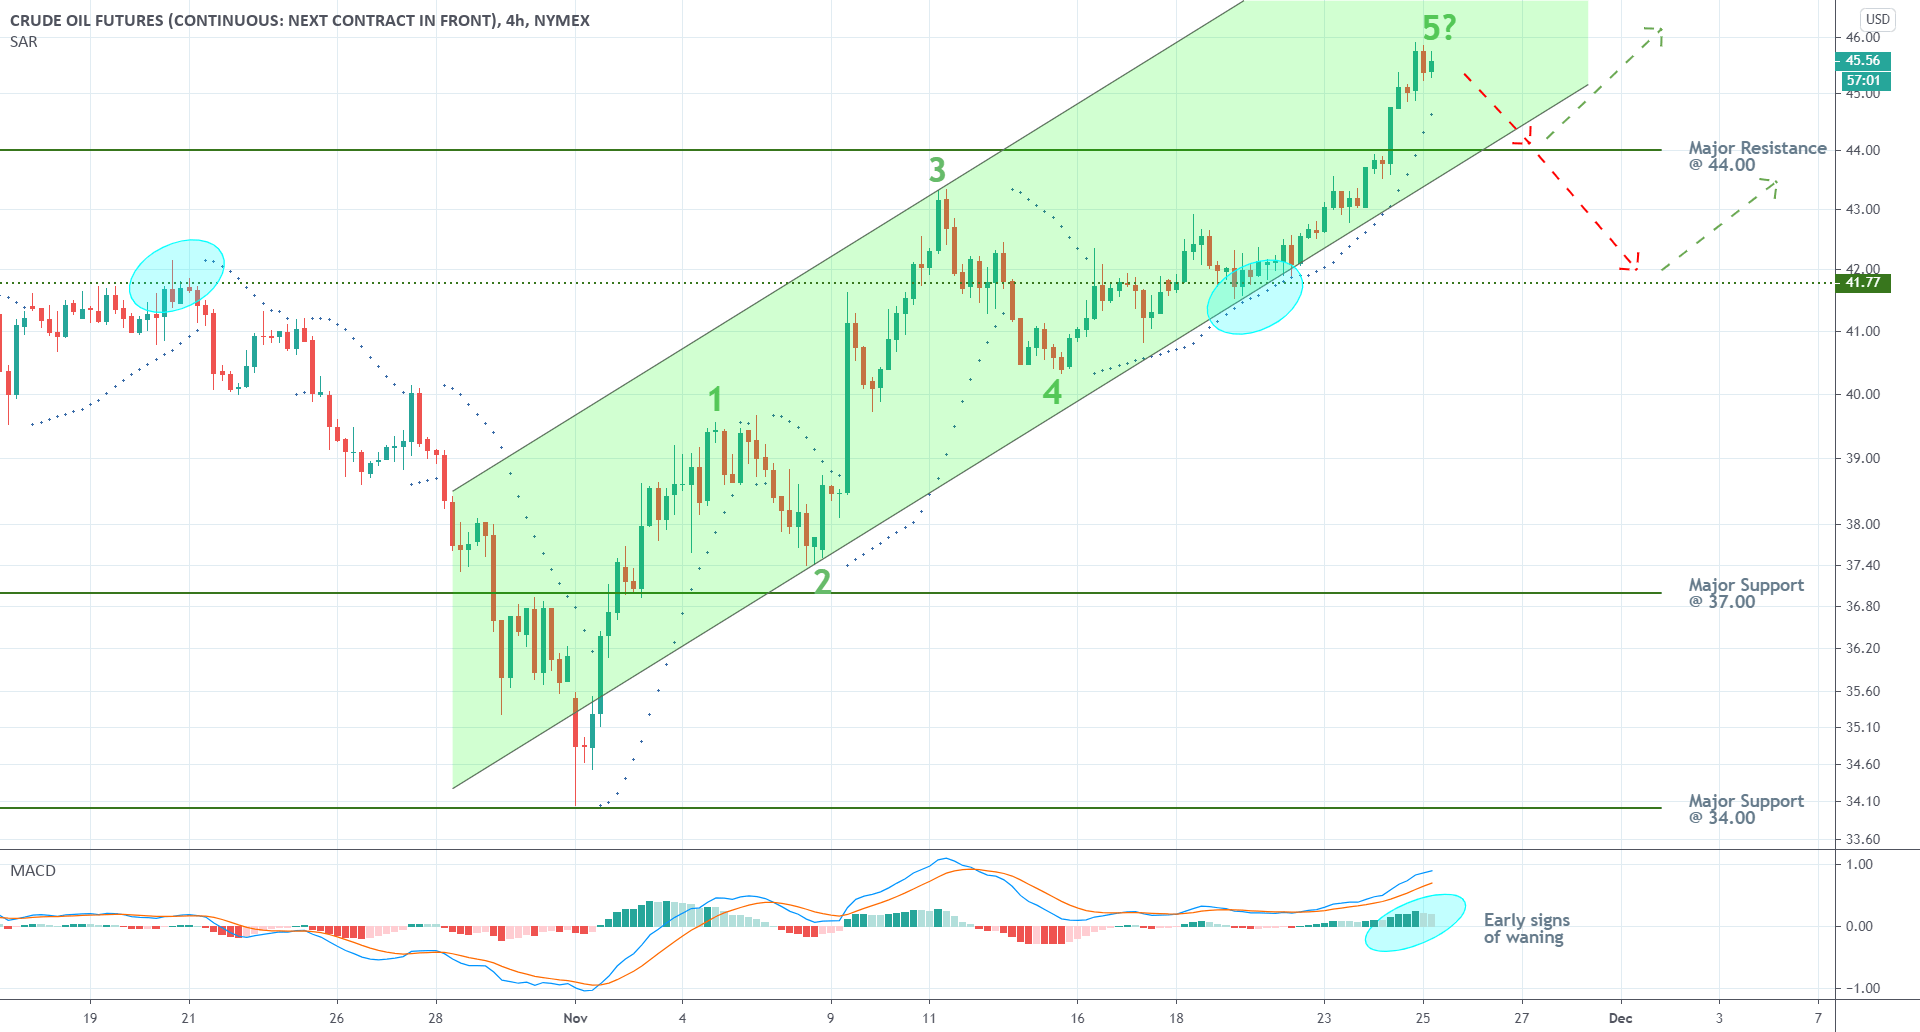
As can be seen on the 4H chart below, the evolving 1-5 impulse wave pattern, which played a crucial role in the last follow-up, continues to represent a significant indicator of the latest price sentiment. Given that the price action is currently in the process of establishing the final impulse leg (4-5), a subsequent bearish correction seems highly plausible, which is also inlined with the aforementioned projections.
Such a correction is likely to form a dip around the major resistance (currently becoming a support) level at 44.00, as was argued earlier. Hence, market bulls should be looking for opportunities to join the market after a rebound from 44.00. However, if the short-term bearish commitment proves to be stronger than anticipated, the price could slide as low as the minor support level at 41.77 before the bulls regain control. This scenario should be considered carefully, especially by more risk-averse traders.
At present, the underlying momentum remains ostensibly bullish, as demonstrated by the MACD indicator. Nevertheless, the histogram is already showing early signs of exhaustion, which could be a precursor to the expected bearish correction.
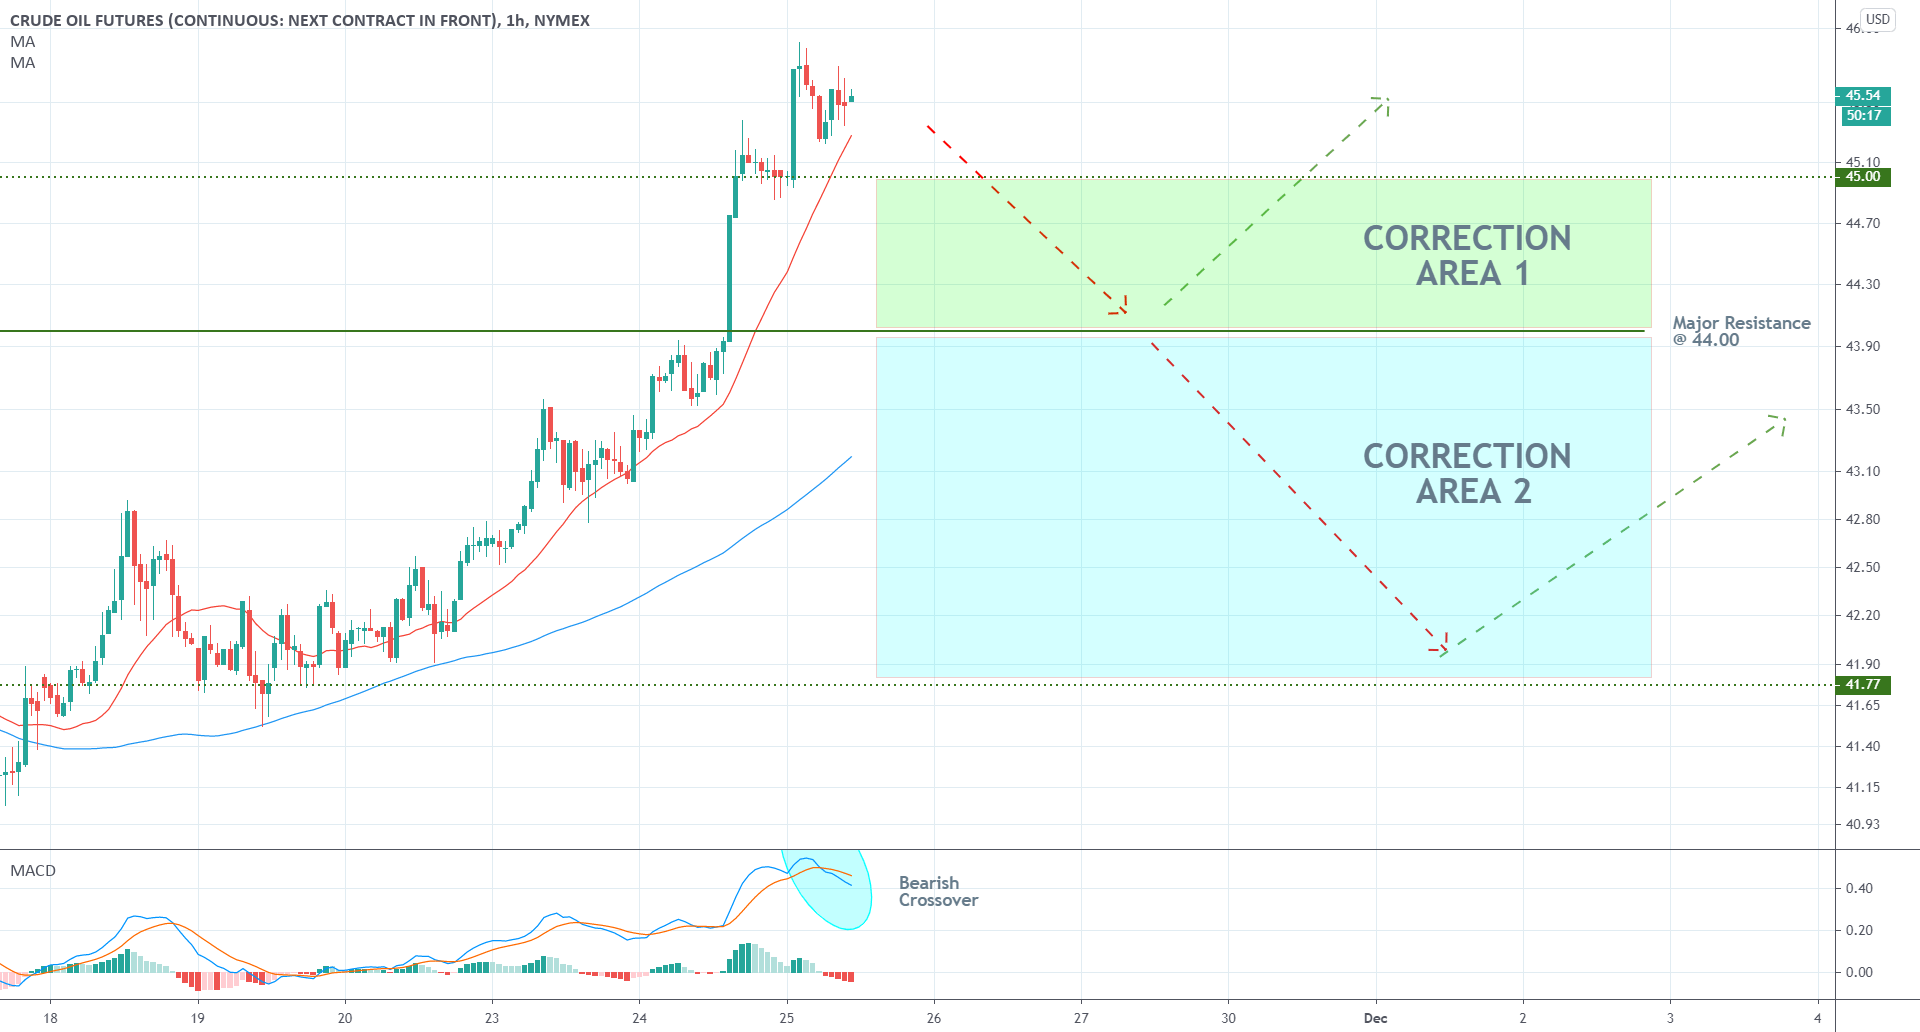
The MACD has already formed a bearish crossover on the hourly chart below, which represents an even more substantial piece of evidence that bearish momentum is rising in the very short-term.
The expectations for the development of a temporary bearish correction towards 44.00 are going to be further substantiated if the price action breaks down below the 20-day MA (in red). The latter is serving the role of floating support, similarly to the 100-day MA (in blue).
As regards the possibilities for trading on the current setup, traders need to approach them with caution, despite the pronounced bullish sentiment. What this implies is that traders who do not have open positions at present should refrain from joining the market right away - even if the price action resumes climbing without an intermediate correction. As was mentioned earlier, the uptrend has already passed the seventh-day mark of consecutive gains, so imprecise entry would expose the trader to an eventual dropdown.
3. Concluding Remarks:
Traders should look for opportunities to use trend-continuation strategies once the price action drops to one of the two closest support levels; or at any rate, look for the next clearly distinguishable dip. These potential scenarios are represented by the two Correction Areas on the chart above. As was mentioned earlier, the psychological resistance at 50.00 remains the primary target for the nascent uptrend. Remember also to use narrow stop-loss orders close to the entry at the dip.
Author

Plamen Stoyanov
Trendsharks
Plamen started his career on the global capital markets in 2012 when he began trading with financial derivatives.


