USD/JPY Forecast: Resuming its downward move?

USD/JPY Current price: 113.70
View Live Chart for the USD/JPY
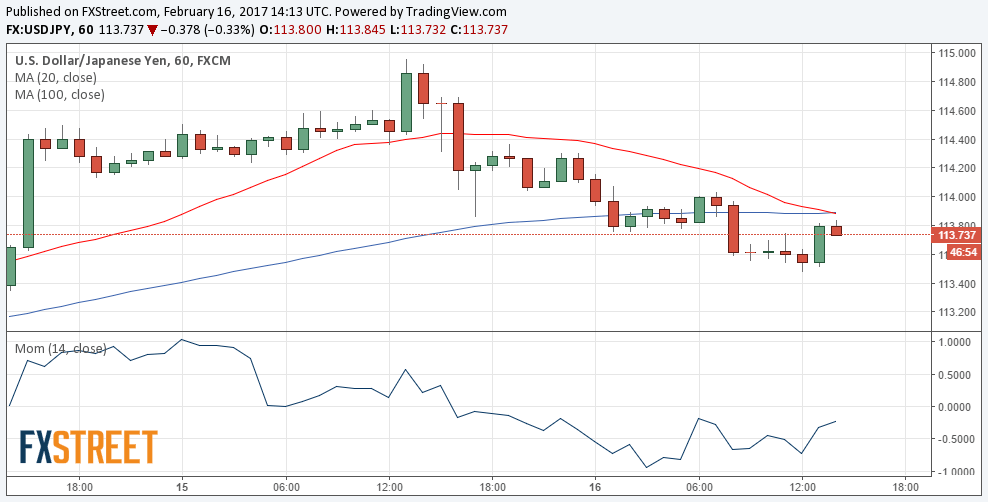
Resuming its downward move? The USD/JPY pair fell down to 113.47, trimming all of its weekly gains, and trading sub-114.00. Bulls' optimism is being dented by falling equities in Europe, although so far, the slide has been moderate. Limiting the decline are US Treasury yields, holding around 2.47%-2.48% ever since late Wednesday. With no data ahead in Japan and little in the US docket, the pair will likely keep on taking clues from stocks. The big retracement following the approach to the 115.00 region, indicates how sensitive the dollar is to uncertainty surrounding the new administration, with investors taking profits out of the table as quickly as possible on the slightest sign. Technically, the 1 hour chart shows that the price is developing below a horizontal 100 SMA, whilst technical indicators have recovered from oversold readings, but lost upward strength below their mid-lines. In the 4 hours chart, the pair has bounced from an also flat 100 SMA, whilst technical indicators hover within neutral readings, with no certain directional strength. Below 113.25, the risk of a bearish acceleration increases, with the pair then poised to test 112.50.
Support levels: 113.25 112.80 112.50
Resistance levels: 114.00 114.45 114.90
Interested in USD/JPY technicals? Check out the key levels
Author

Valeria Bednarik
FXStreet
Valeria Bednarik was born and lives in Buenos Aires, Argentina. Her passion for math and numbers pushed her into studying economics in her younger years.


