![]() Lara Iriarte, CMT
Lara Iriarte, CMT
Elliott Wave Gold
Last analysis on the 10th of June expected a deep correction for a B wave. Price has mostly moved sideways, and has now formed a fairly well defined consolidation zone. A correction has developed, but at this stage it is not deep.
BEARISH ELLIOTT WAVE ANALYSIS
QUARTERLY CHART
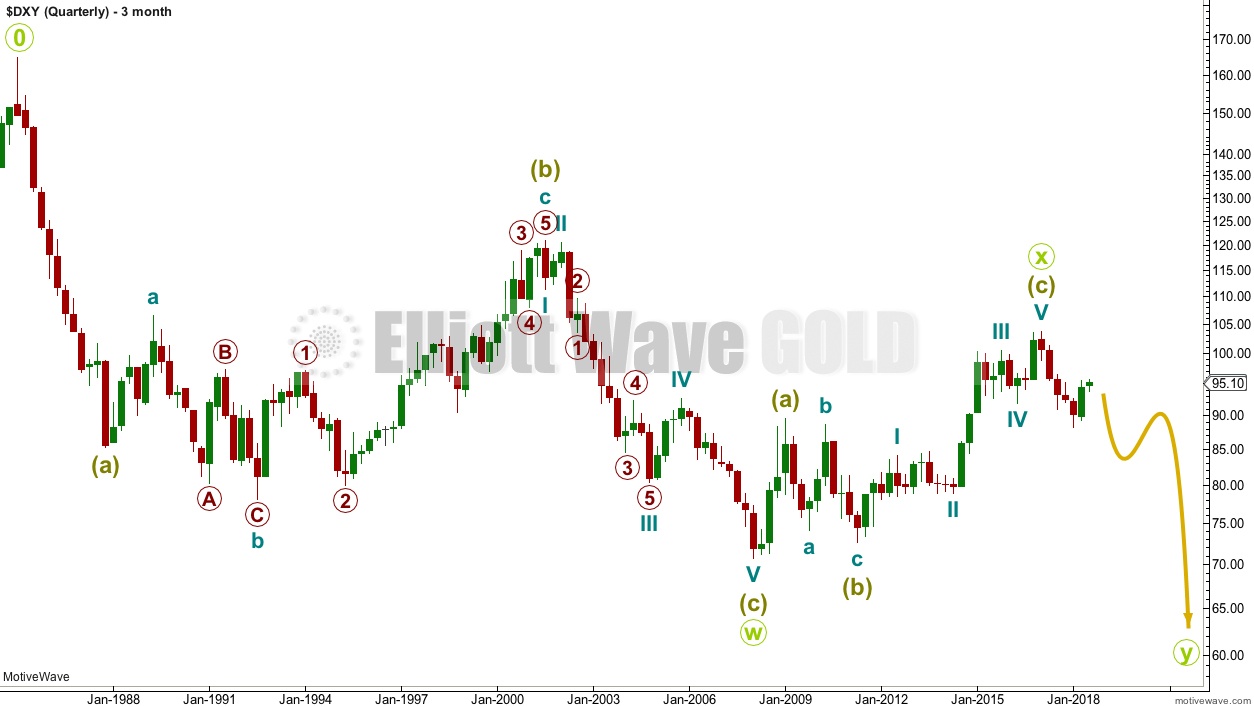
The wave count begins at 0.
A huge double zigzag may be continuing lower.
MONTHLY CHART
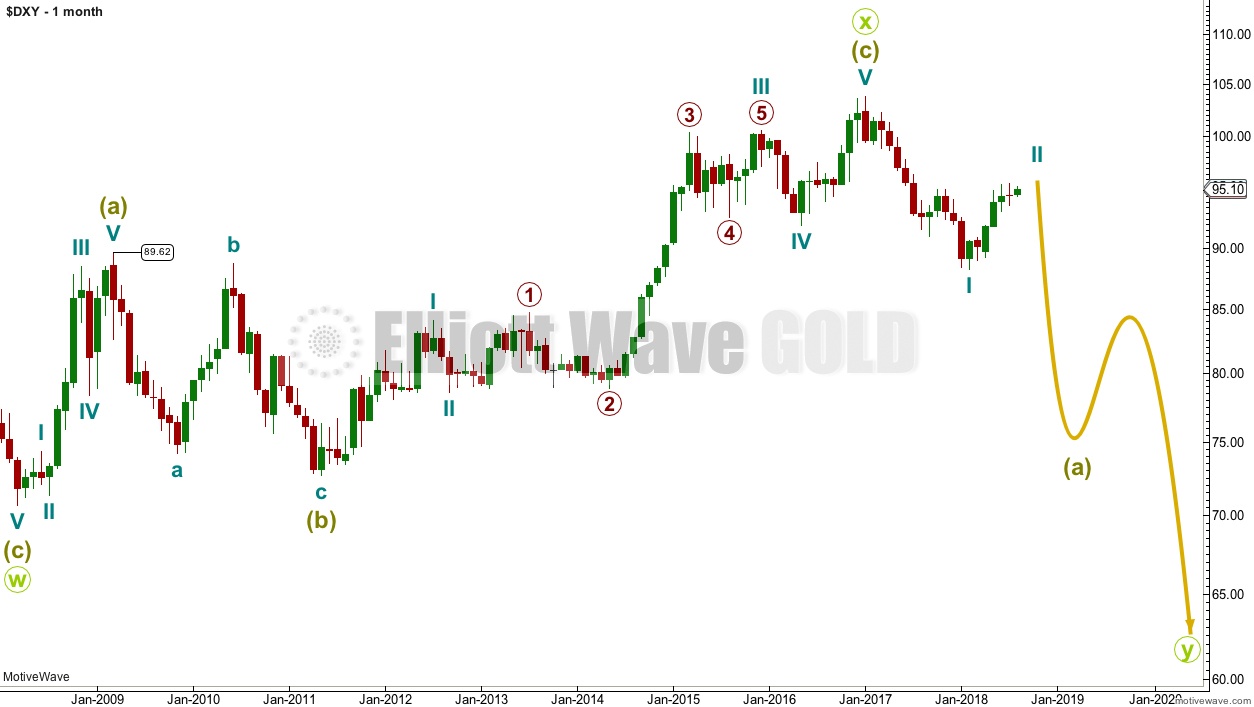
Downwards movement from the high in January 2017 cannot be a fourth wave correction within an ongoing impulse higher because a new low below 89.62 would be back in first wave price territory.
That indicates the last big wave up may be a completed three, and for that reason this is my main wave count.
WEEKLY CHART

Cycle wave I downwards fits very well as a five wave impulse. This may be reasonably expected to be followed by a three wave structure upwards.
So far upwards movement has developed a little more since last analysis. This now looks like an almost complete five up.
If cycle wave II is beginning with a five up, then it may be unfolding as a zigzag, which is the most common type of corrective structure.
When primary wave A is a completed five wave impulse, then primary wave B should begin.
Cycle wave II may not move beyond the start of cycle wave I above 103.82.
DAILY CHART
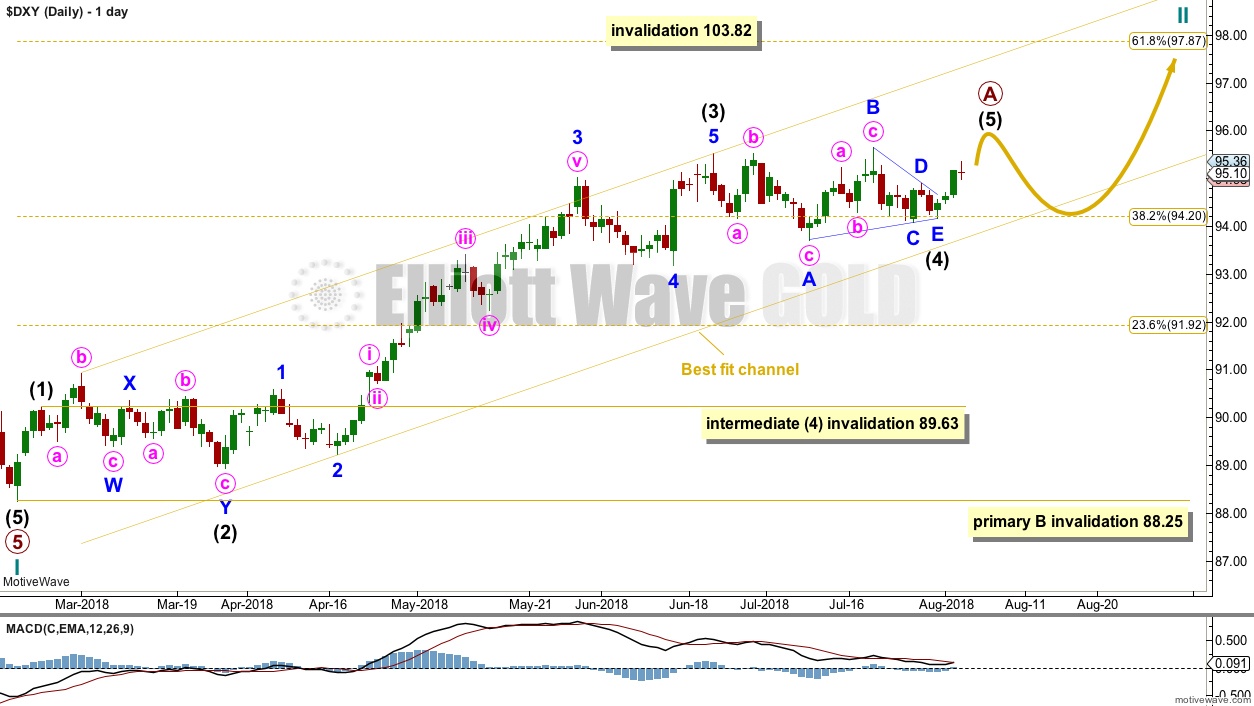
So far primary wave A fits very well as an almost complete five wave impulse.
There is excellent alternation between the double flat correction of intermediate wave (2) and the triangle of intermediate wave (4). There is no adequate Fibonacci ratio between intermediate waves (1) and (3).
Within intermediate wave (3), there are no adequate Fibonacci ratios between minor waves 1, 3 and 5.
So far primary wave A remains contained within a channel. When price breaks out of the lower edge of the channel, then that may be an indication that primary wave A is complete and primary wave B may then have begun.
While primary wave A looks incomplete, intermediate wave (4) may not move into intermediate wave (1) price territory.
When primary wave A could be complete, then the following correction for primary wave B may not move beyond the start of primary wave A.
Primary wave B may be any one of more than 23 possible corrective structures. It may be choppy and overlapping as a combination, flat or triangle, or it may be a more brief sharp pullback as a zigzag. It may be expected to last anywhere from about 4 to 8 months.
BULLISH ELLIOTT WAVE ANALYSIS
QUARTERLY CHART
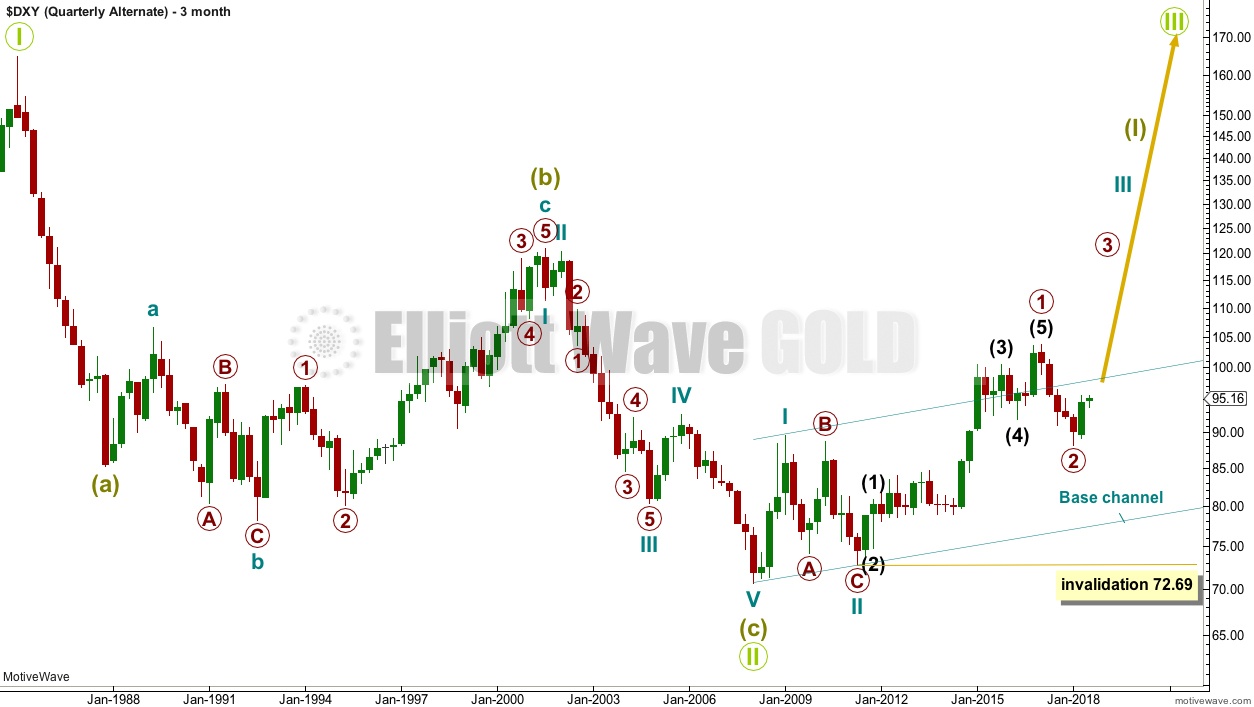
A single zigzag down to the last major low may still be complete.
A new upwards trend may continue. So far there may be two overlapping first and second waves. Primary wave 2 may not move beyond the start of primary wave 1 below 72.69.
Primary wave 2 should find strong support at the lower edge of the teal base channel if it gets down that low.
MONTHLY CHART
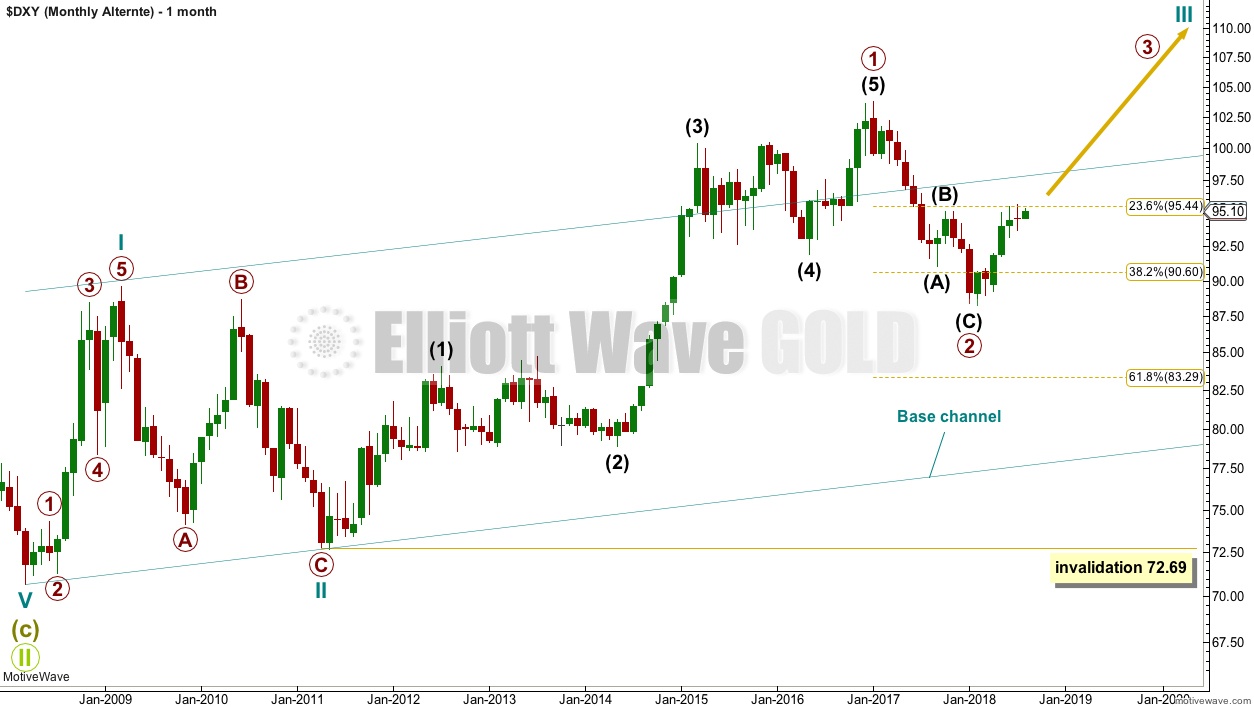
Primary wave 2 may be a complete zigzag. However, this wave down can also be seen as a five and primary wave 2 may yet continue lower.
WEEKLY CHART

This bullish wave count sees the last wave down as a completed zigzag. If this is correct, then within primary wave 3 no second wave correction may move beyond its start below 88.25.
TECHNICAL ANALYSIS
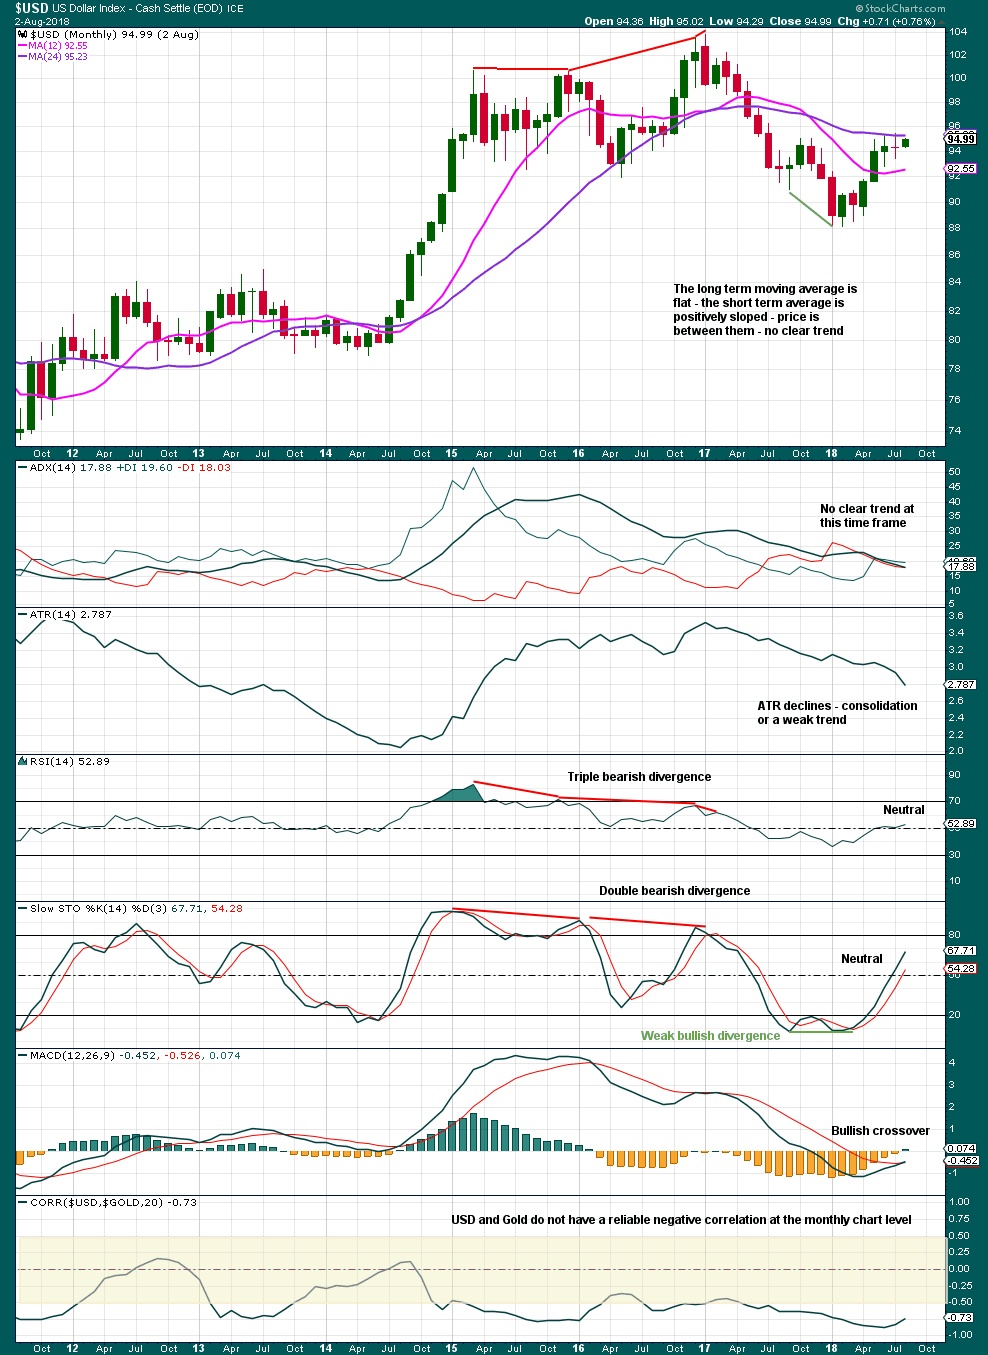
MONTHLY CHART
DAILY CHART
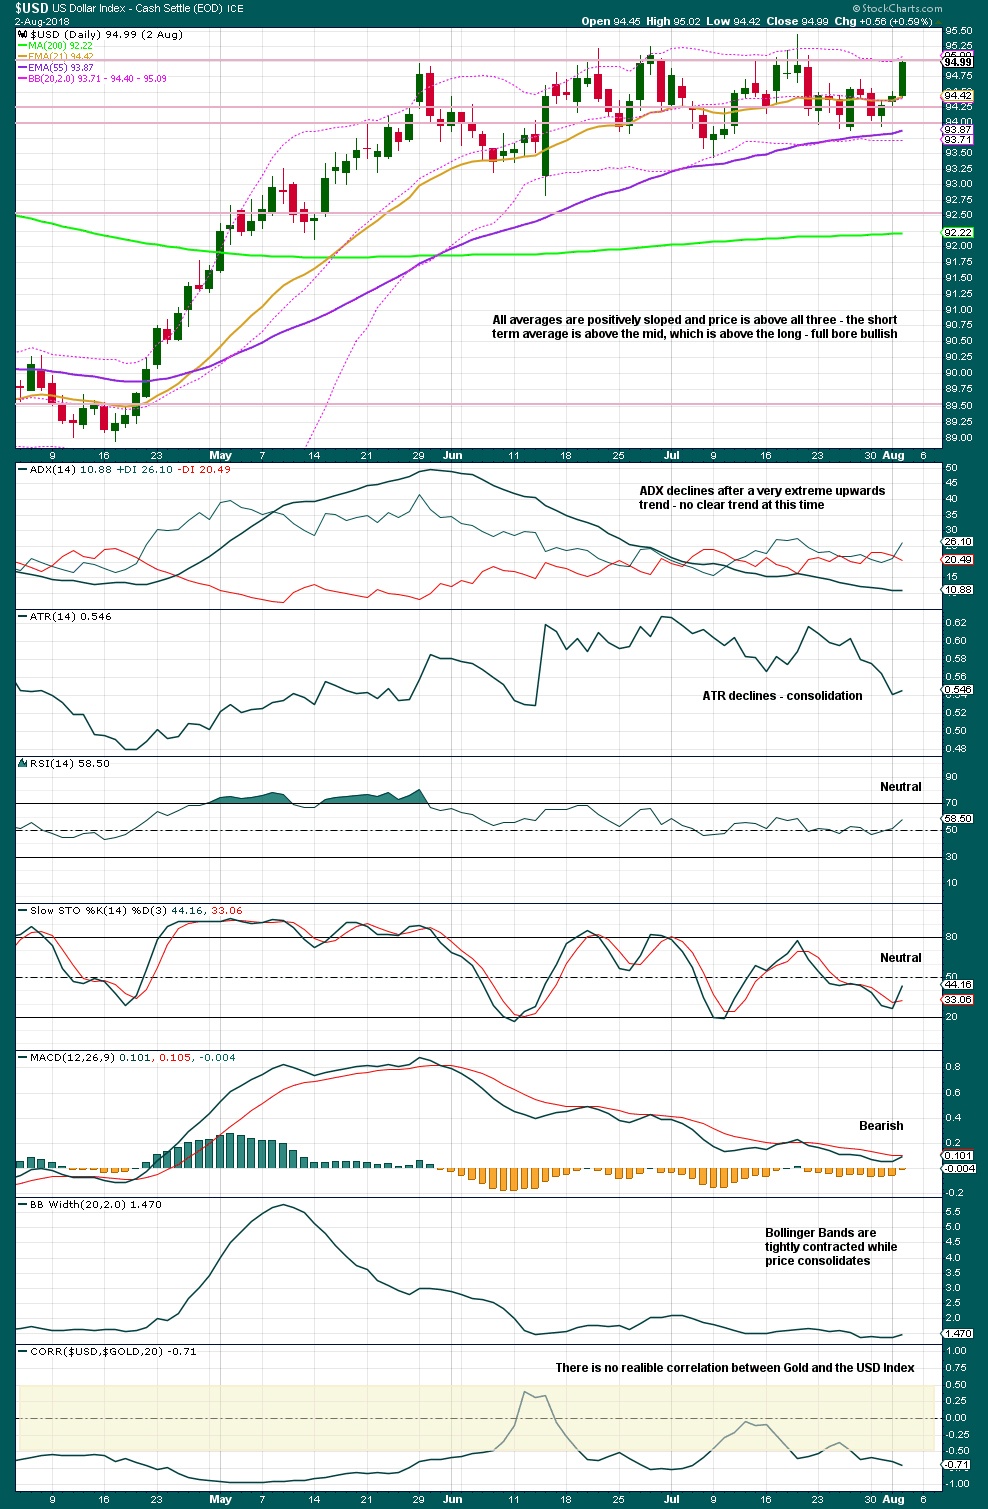
Price is consolidating with resistance in a zone about 95.00 to 95.45 and support in a zone about 93.45 to about 92.85. Unfortunately, neither StockCharts nor BarChart provide volume data for the USD Index. If they did, then the direction of the day with strongest volume would be an indicator of the most likely breakout direction from the consolidation.Price is consolidating with resistance
Our service is educational, we aim to teach you how to learn to perform your own Elliott wave analysis.
Recommended Content
Editors’ Picks
EUR/USD edges lower toward 1.0700 post-US PCE

EUR/USD stays under modest bearish pressure but manages to hold above 1.0700 in the American session on Friday. The US Dollar (USD) gathers strength against its rivals after the stronger-than-forecast PCE inflation data, not allowing the pair to gain traction.
GBP/USD retreats to 1.2500 on renewed USD strength

GBP/USD lost its traction and turned negative on the day near 1.2500. Following the stronger-than-expected PCE inflation readings from the US, the USD stays resilient and makes it difficult for the pair to gather recovery momentum.
Gold struggles to hold above $2,350 following US inflation

Gold turned south and declined toward $2,340, erasing a large portion of its daily gains, as the USD benefited from PCE inflation data. The benchmark 10-year US yield, however, stays in negative territory and helps XAU/USD limit its losses.
Bitcoin Weekly Forecast: BTC’s next breakout could propel it to $80,000 Premium

Bitcoin’s recent price consolidation could be nearing its end as technical indicators and on-chain metrics suggest a potential upward breakout. However, this move would not be straightforward and could punish impatient investors.
Week ahead – Hawkish risk as Fed and NFP on tap, Eurozone data eyed too

Fed meets on Wednesday as US inflation stays elevated. Will Friday’s jobs report bring relief or more angst for the markets? Eurozone flash GDP and CPI numbers in focus for the Euro.