US ISM Non-Manufacturing PMI December Preview: Last call for the concerned?
- Services PMI expected to edge higher in December despite the drop in manufacturing.
- New orders index in services has improved in the last two months.
- Employment has bounced from September's five year low.

The Institute for Supply Management (ISM) will issue its Non-Manufacturing Purchasing Managers’ Index for December on January 7th at 15:00 GMT, 10:00 EST.
Forecast
Services PMI is projected to increase to 54.5 in December from 53.9 in November. The business activity index is predicted to rise to 52.0 in December from 51.6 the prior month. The employment index was 55.5 in November and 53.7 in October. The new orders index was 57.1 in November and 55.6 in October.
ISM non-manufacturing business sentiment
Business sentiment has taken the brunt of the fallout from the US-China trade dispute.
Optimism among executives in the service sector has fallen from 60.8 in September 2018, a 13 year high, and 59.7 last February, to 52.6 in September. Recovery to 53.9 in November still leaves the outlook below all but two scores of the last three years.
Business activity has fallen from its highest post-recession reading of 64.7 in February 2019 to its lowest 51.6 just 10 months later in November. Employment fell to 50.4 in September, just above the 50 demarcation between expansion and contraction, and then rebounded to 55.5 in November. New orders have executed a partial round trip from 65.2 in February 2019, a 13 year high, to 53.7 in September and back to 57.1 in November.
Manufacturing has been even harder struck. Overall PMI has been in recession for five months with December’s expected slight improvement to 49.0, reported on January 3rd dashed when it registered 47.2 the weakest level since June 2009. Employment at 45.1 was the poorest since January 2016 and new orders at 46.8 were the weakest since April 2009.
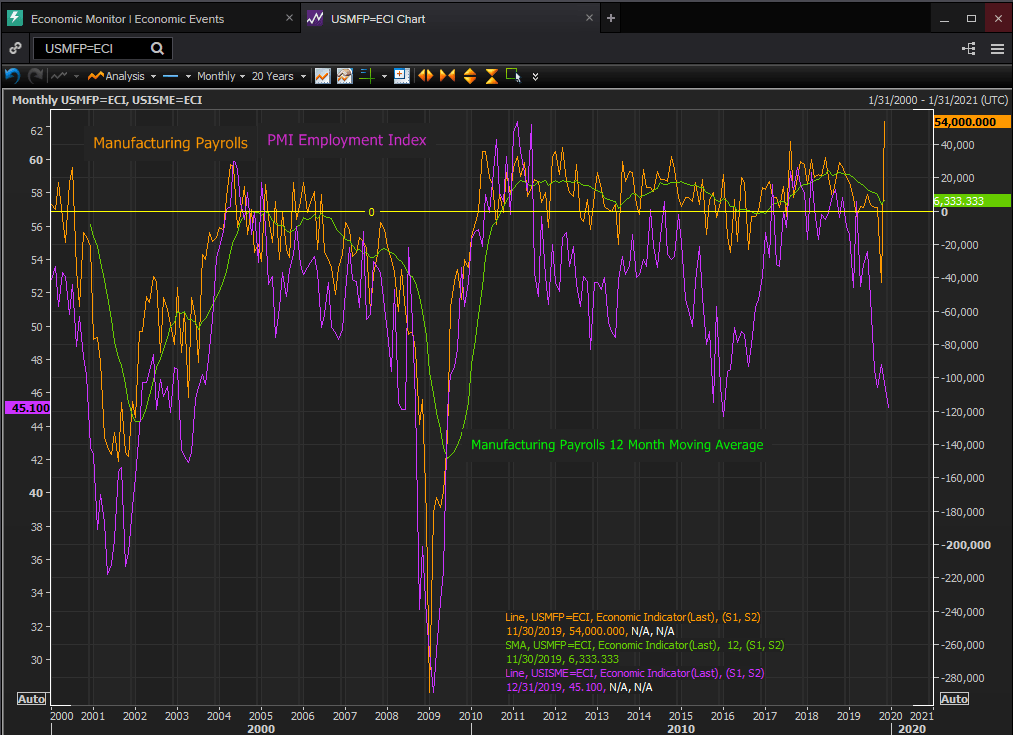
US labor market and PMI employment indexes
In contrast to the sentiment indexes the actual, the consumer sector has remained strong with healthy retail sales and a vibrant labor market. Unemployment is at a five-decade low at 3.5%, 266,000 new jobs were added in November and a 184,000 12-month moving average.
The decline in manufacturing employment has followed the sharp decrease in the employment index. Factory jobs rose an average of 22,000 a month in 2018. By November of last year that was down to 5,000.
The 54,000 gain in November manufacturing payrolls was a reversal of the prior month’s loss of 43,000 due to a short General Motors.strikers in the payroll survey week.
There is a discrepancy between the recessionary depiction of the labor market in the manufacturing employment index, five months below 50 and a four year low in November and the continuous hiring throughout the year. Although the employment index has registered sentiment for contraction actual hiring has remained steady if at lower levels than last year.
This mirrors a similar decline in the manufacturing employment index from June 2015 to September 2016 which saw the monthly average in jobs drop from 13,500 in June to -1,500 the following September.
Reuters
Readings of contraction in the employment index, absent a recession, do not mean an actual loss of factory work but a curtailment of hiring.
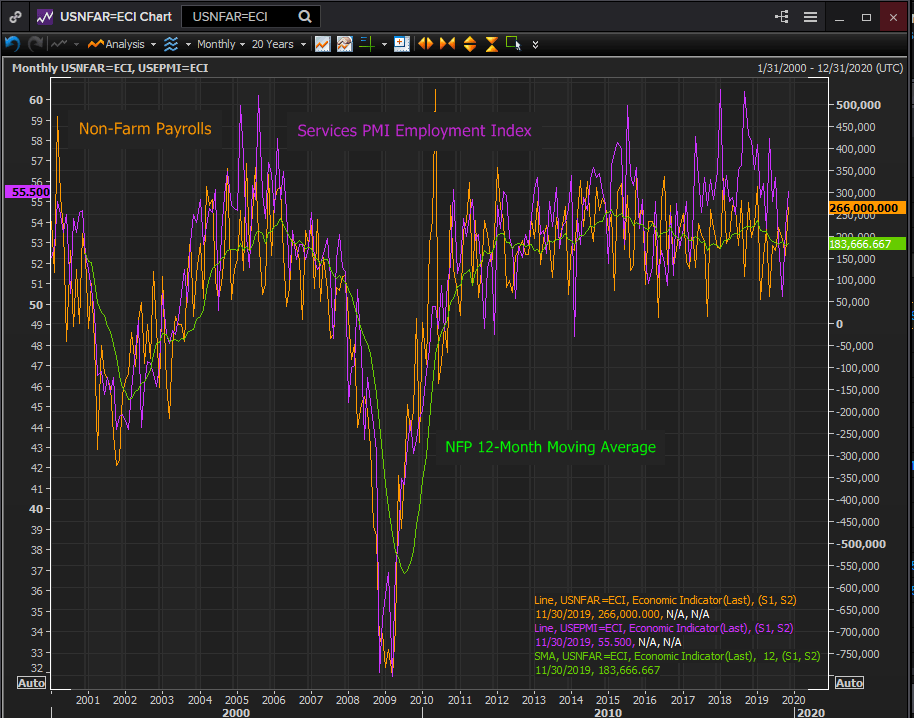
Overall hiring followed a similar path as the service employment index faded in the second half of 2019. From 235,000 in the 12-month average for non-farm payrolls in January to 184,000 in November the drop reflected the decline in the index to 50.4 in September from 58.1 in May.
Reuters
Conclusion
The decline in the manufacturing and services PMI indexes over the course of last year reflect more a concern about the future than a notice of a weakening current economy.
The US economy expanded at a 2.4% annualized pace through the first three quarters and is estimated at 2.3% in the fourth by the Atlanta Fed. The labor market and the consumer economy mirrored that reality rather than the rising worries of business executives gazing into the future depicted in the several PMI indexes.
China and the US have agreed on initial terms for a trade pact. Given all of the rhetoric, antagonism and false starts over the past two years, it is understandable that executives prefer to wait for the signed text before committing resources in new investment. Expect these indexes to begin to imitate life in the first quarter.
Author

Joseph Trevisani
FXStreet
Joseph Trevisani began his thirty-year career in the financial markets at Credit Suisse in New York and Singapore where he worked for 12 years as an interbank currency trader and trading desk manager.


