US dollar begins the week lower but is it a trend changing move?

Market Overview
After the big dollar rally of the past week, there is a degree of unwind across major markets today. The developments in the trade dispute between the US and China continue to dominate the broad market sentiment. Whilst US President Trump pushed back on claims that both sides were ready to reduce tariffs proportionately, there is a sense that some sort of agreement is close. There has been a significant steepening of the US yield curve in recent weeks and an accelerated move higher in longer dated yields has helped to strengthen the dollar. The move has also seen a realignment of flow out of bond markets and into equities to push Wall Street into all-time high territory. The move has also see assets such as gold also starting to show signs of direction after weeks of painstaking range play. A mild unwind in all of these moves is being seen early today but with little real driver, so is unlikely to be the start of a turnaround quite yet.

Wall Street closed higher into the end of the session on Friday with the S&P 500 +0.3% at 3093. US futures are corrective today though, down around -0.4%. Asian markets are lower with the Nikkei lower by -0.3%, whilst the Shanghai Composite -1.8% after Chinese PPI fell more than expected. European markets are following US futures lower with the FTSE futures and DAX futures both -0.4%. There is a USD slip across forex majors today with the only exception being a slight underperformance on AUD. In commodities, gold has rebounded slightly by around half a percent, whilst oil is a percent lower.
On the economic calendar the big focus is on UK growth. At 0930GMT the Prelim reading of UK Q3 GDP is expected to grow by +0.4% (form a final reading of -0.2% in Q2). UK Industrial Production for September with a loss of -0.2% in the month of September which would improve the year on year to -1.2% (from -1.8% YoY in August). Furthermore the UK Trade Balance is also at 0930GMT which is expected to marginally deteriorate to -10.0% in September (-£9.8bn in August).
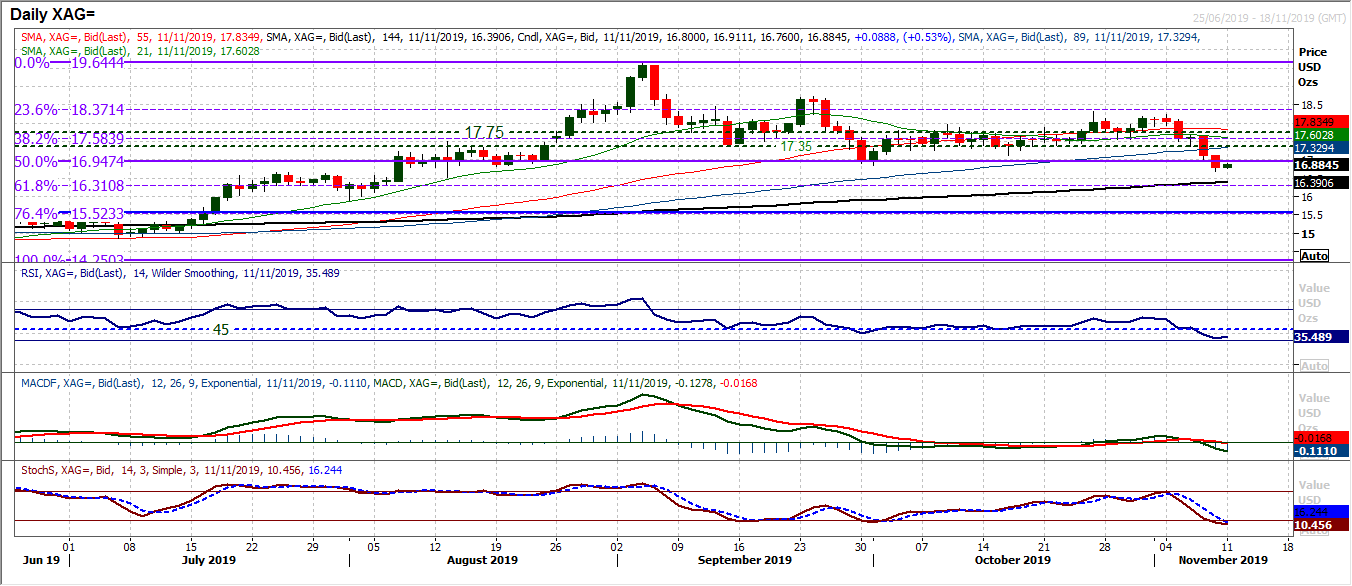
Chart of the Day – Silver
There has been a significant deterioration in the outlook for precious metals in recent days. This has resulted in a breakdown on silver. A closing break below the October low of $16.85 took silver to a two and a half month low and if confirmed today, marks a significant shift in outlook. The market has been relatively stable over recent months in a sideways range (between 40/60 on RSI), but Friday’s decisive move lower has come with RSI under 40 to a five month low, whilst MACD lines are getting traction now. If the move is confirmed by a second day closing breach of $16.85 then a much deeper correction could be developing. The breach of the 50% Fibonacci retracement at $16.95 means that this opens a downside test of the 61.8% Fib around $16.30 as the next move. The overhead supply of $16.85/$17.12 also becomes an area of resistance and potential sell zone now. Subsequently the early rebound this morning could be viewed as an opportunity if the rally starts to stall. Initial support around $16.55 under which is August higher low at $15.88.
WTI Oil
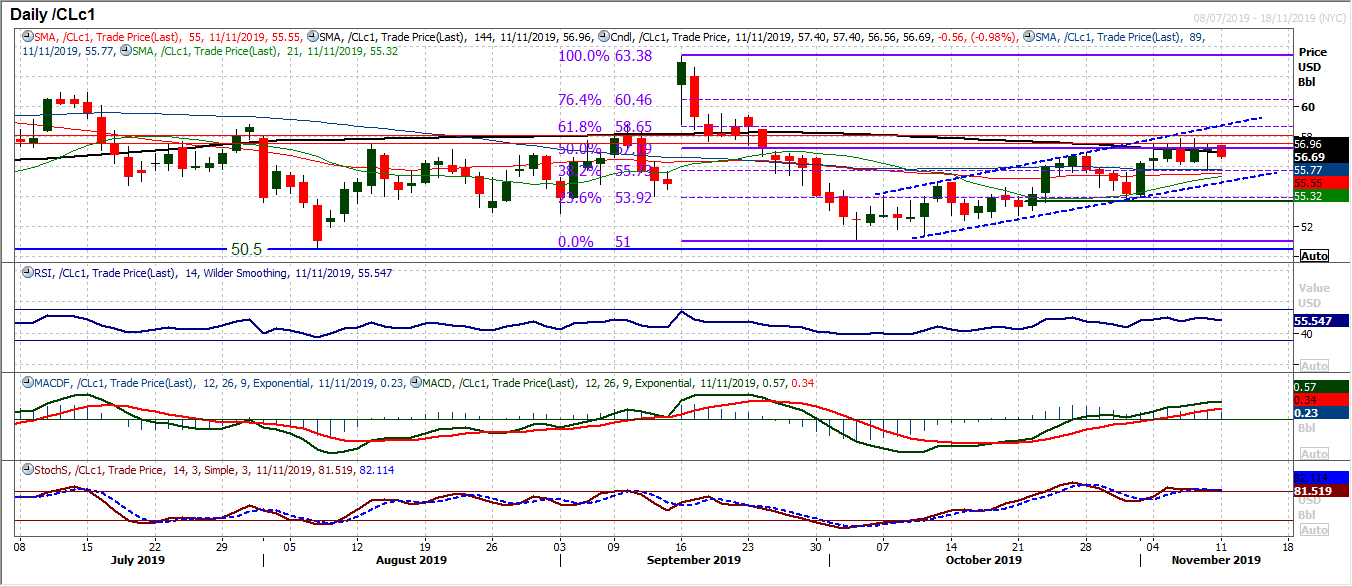
The development of the uptrend channel in recent weeks has continued to form an outlook of buying into weakness on oil. Whilst there is a continued lack of conviction that leads to oil intermittently slipping back, the bulls still retain a degree of control. Last week the resistance around an old pivot band around $57.50/$58.00 prevented another leg higher towards the top of a five week uptrend channel (which today comes in at $58.70 and is a confluence with the 61.8% Fibonacci retracement (of $63.50/$51.00) at $58.65. We continue to view the bottom of the channel around $55.00 today as an area the bulls would look for an opportunity again.
Dow Jones Industrial Average
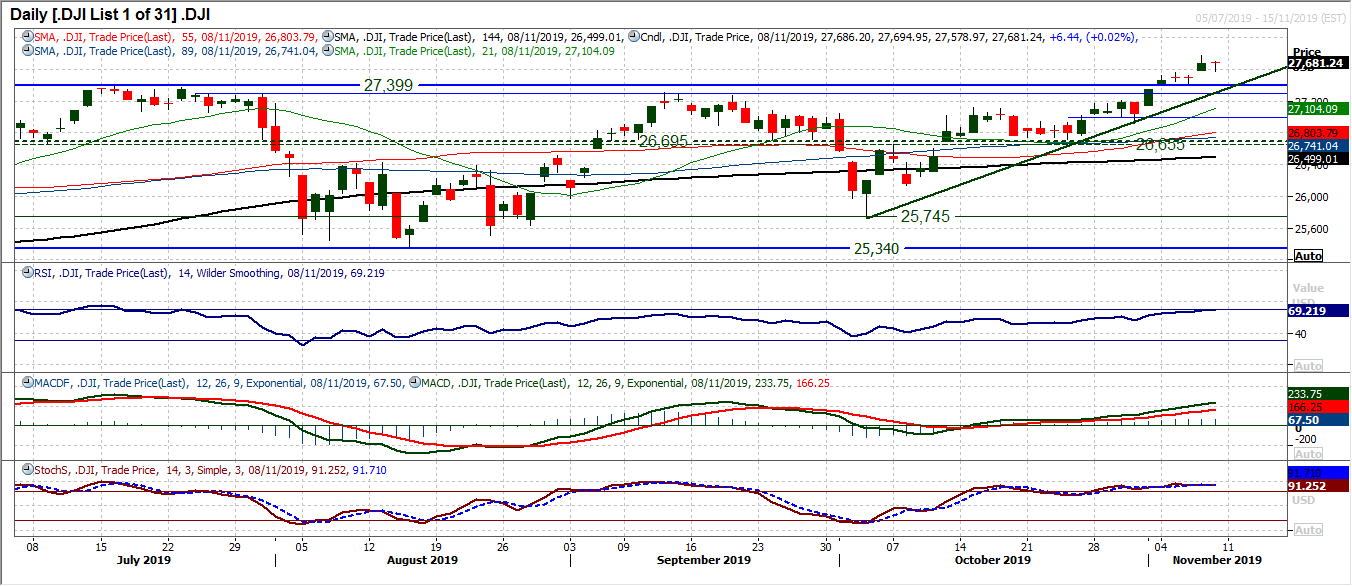
There is still a propensity for the bulls to use weakness as a chance to buy the Dow. Another gap higher on Thursday just stalled slightly into Friday, but intraday weakness was bought into to close the day near to session highs. Traditionally, a doji candle suggests an uncertainty in the prevailing trend, however, two of the past three breakout gaps remain unfilled and the latest gap at 27,527 is currently adding another unfilled gap. The bulls are in control of the market and holding on to the 27,305/27,399 support band is a key band of underlying demand. The new all-time high (from Thursday (at 27,775) is resistance initially. The strength of momentum in this run higher is across the indicators, with RSI towards 70 and MACD lines rising solidly. The hourly chart shows a solid positive configuration and this is a run that has not finished yet.
Other assets insights
EUR/USD Analysis: read now
GBP/USD Analysis: read now
USD/JPY Analysis: read now
GOLD Analysis: read now
Author

Richard Perry
Independent Analyst


