Trade talks progress start to weigh on the dollar, risk positive
Market Overview
The apparent progress that is coming in the US/China trade talks is helping to drive more elevated levels of risk, but also is now beginning to weigh on the US dollar. Donald Trump’s speech on Friday confirmed that there is a good chance that the deadline of the 1st March for the trade negotiations could now be extended. This would at least delay the imposition of tariff hikes, but markets are taking it that the deadline extension would be due to a high likelihood of an agreement being reached. Signals from both side suggested that talks went well in Beijing last week and will continue over in Washington in the coming days. This progress is being reflected through financial markets and across asset classes, with Treasury yields edging higher, strong gains on equity markets (at least on Friday), whilst there is a decisive move out of the safer havens in the forex space with yen weakness especially but also out of the dollar. Commodities, priced in dollars, are also benefitting, with oil continuing its breakout to multi-month highs and the medium term gold rally also looking to gain traction once again. There are also a range of interesting crossroads that several of the major forex pairs have reached and this could be a pivotal moment for the dollar.

On Wall Street there was a strong move into the close on Friday with the S&P 500 +1.1% at 2775, whilst US futures are ticking a shade higher this morning. Asian markets have certainly felt the benefit, with the Nikkei +1.8% and the Shanghai Composite +2.6%. However, this enthusiasm has been tempered on the changeover to the European session, with FTSE futures (flat) and DAX futures (+0.1%) showing little desire to drive forward. In forex, the moves against the dollar from Friday have continued into today with the better risk appetite, with the yen and dollar broadly weaker again. For commodities, the dollar weakness is helping gold and silver to edge higher, whilst oil continues a solid climb higher.
There are no key economic releases on the calendar today.
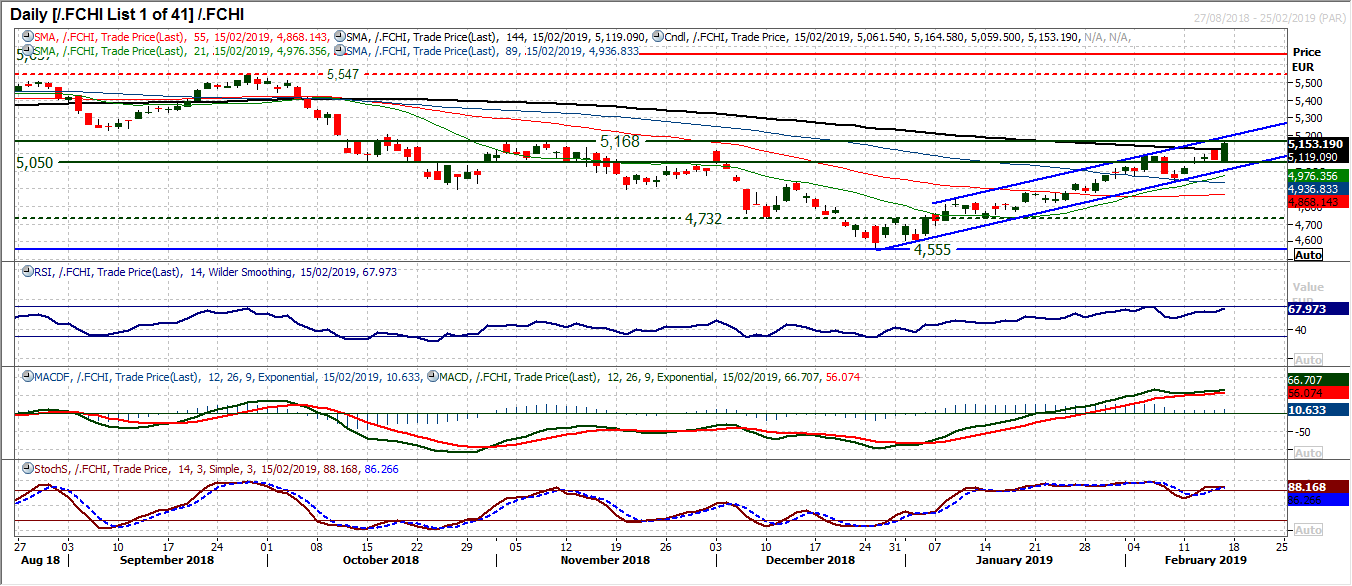
Chart of the Day – French CAC 40 Index
The DAX may get a lot of the headlines for Eurozone equities but the French CAC should not be ignored as the recovery is progressing very well. In the past six weeks there has been a very well-defined uptrend channel formation that has pulled the CAC higher by 13% from the low of 4555. The recovery is far more technically developed for the bulls than the German market. The key development is the decisive move above 5050 which had previously been the key basis of a floor throughout 2017/2018 and therefore key overhead supply (the equivalent on the DAX is the 11,725/11,865 band). With the huge bull candle on Friday the market is now testing the key November high at 5168. The move comes with impressively strong RSI in the high 60s, MACD lines tracking higher and the Stochastics in bullish configuration. Corrections are a chance to buy on the CAC and there is an increasingly strong band of support 5050/5083 to use as a chance to buy. A close above 5168 would continue the channel (the channel resistance is at 5202 today) with the next resistance at 5226 also open. A close below the six week uptrend channel at 5015 would break the run higher.
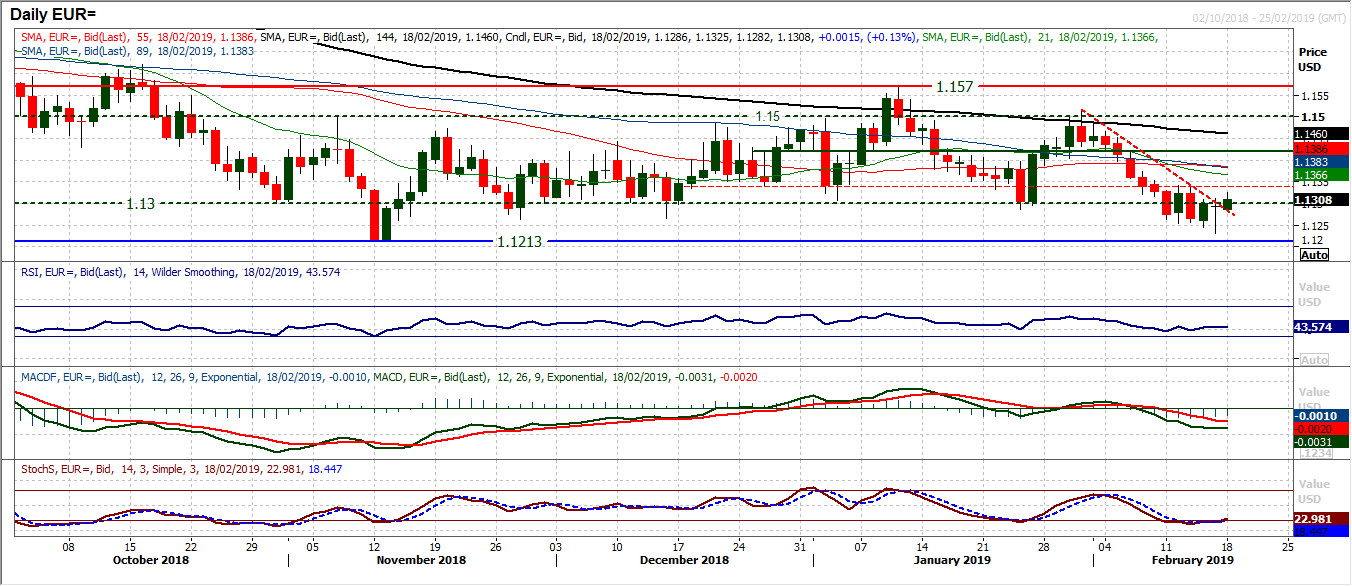
Since the breakdown below the old key floor around $1.1300 there has been an ongoing battle for control. Back and forth from the bulls with the bears trying to confirm the break. The battle continues today but there is a mild shift in favour of the bulls forming. A positive candle Thursday, followed by a doji candle on Friday (open and close at same level) but with a move that saw a rebound to leave support at $1.1230. With another mild gain today, this is an important moment for the pair. A move above the resistance band $1.1300/$1.1345 would really improve the outlook. This comes with the Stochastics ready to bottom, along with the MACD lines and RSI also potentially ready to turn higher in confirmation. A close above $1.1345 (last week’s high) could be key. The hourly chart is showing far more neutral configuration with the hourly RSI pulling above 60 and hourly MACD lines more considered above neutral. This is a pair where the bulls are showing far more signs of improvement. A price confirmation above $1.1345 would confirm this.
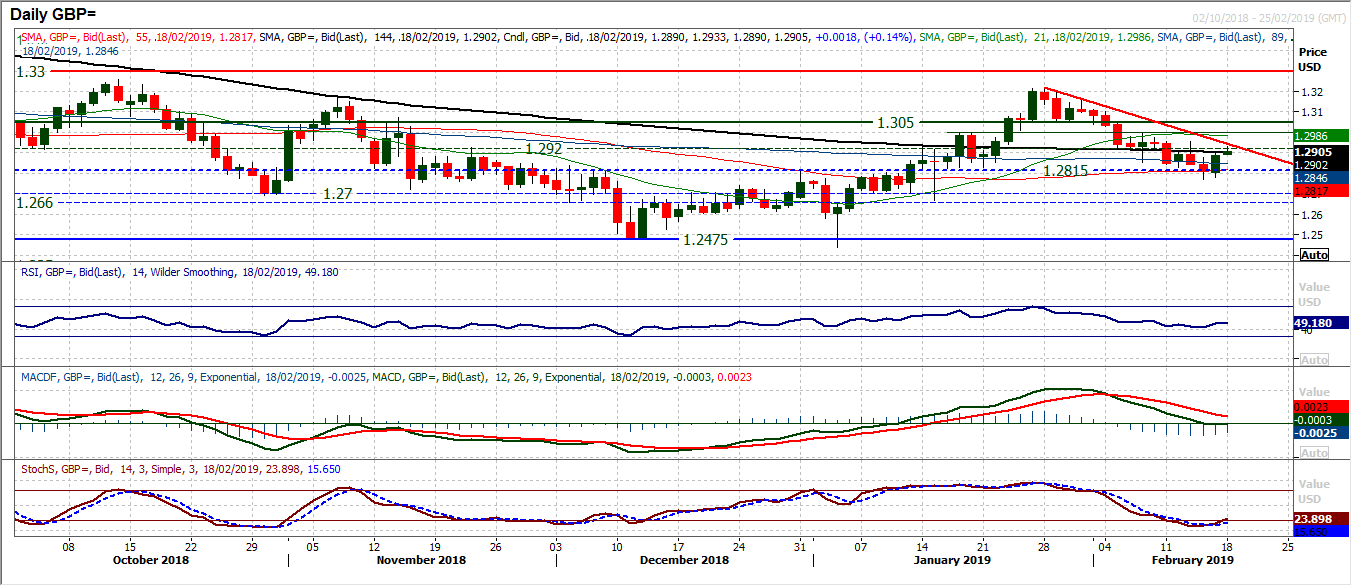
The solid positive candle on Friday has been followed early today with another move higher, leaving Cable at an intriguing position once more. For three weeks, rallies have been sold into. The market has been trending lower as a series of lower highs and lower lows has formed. Support levels of old pivot bands have continually given way and the market has corrected into the middle of the medium term trading band broadly between $1.25/$1.33. However, a breach of $1.2815 support was never confirmed and a rebound back to the old pivot at $1.2920 has set in. How the market performs around this pivot could be key. A lower high at $1.2950 protects the resistance at $1.3000 as the market rebound effectively within the pivots between $1.28/$1.30. The three week downtrend comes in at $1.2940 so a failure here could again be pounced upon. However the momentum indicators are more positive, with a potential Stochastics buy signal, MACD lines steadying around neutral and RSI picking up around 40. A key moment for the pair.
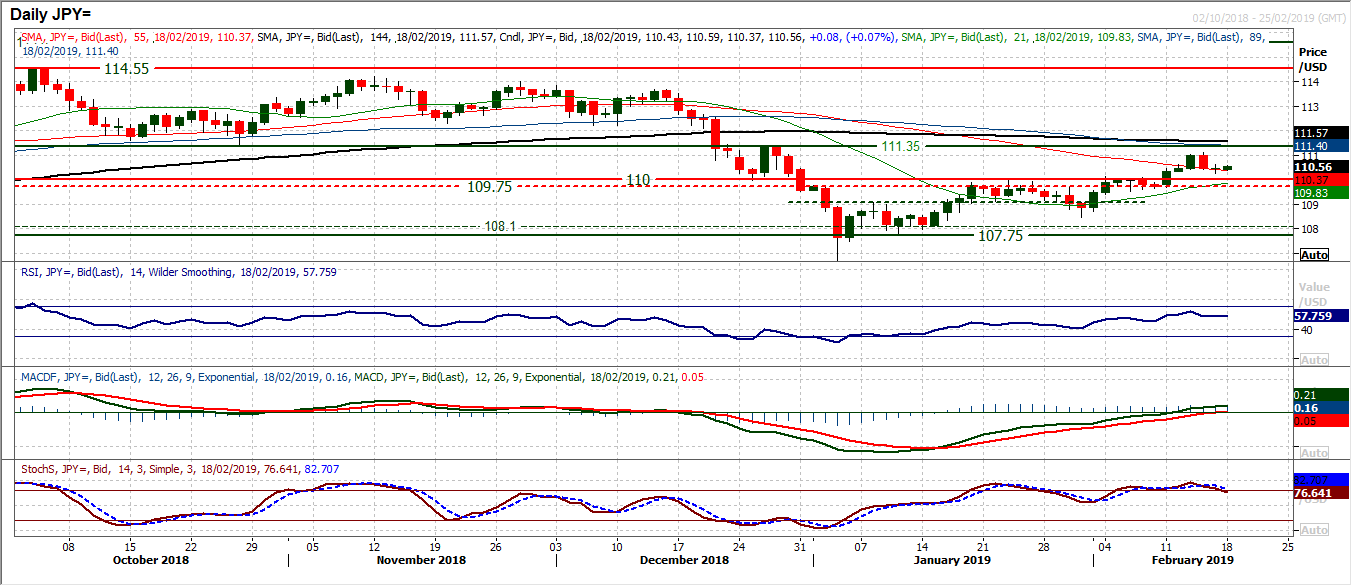
This is another forex major pair where this could be a crucial point on a crossroads. The negative candle on Thursday followed by a small doji on Friday suggests an uncertainty has crept in. Momentum indicators still have a positive configuration but there is also the threat of a corrective slip as the Stochastics threaten a sell signal (could be similar to late January as the market rolled over for a week). The hourly chart shows the momentum of the run higher has dissipated and there is a threat that a more corrective outlook could develop. With the resistance of the recent high around 111.10 if the hourly RSI fails around 60 and hourly MACD lines fail around neutral this could turn into a near term correction again. The resistance between 110.60/110.80 could prove key to this move as if this continues to build then the market could easily begin to drop back into the support of the breakout around 110.00.
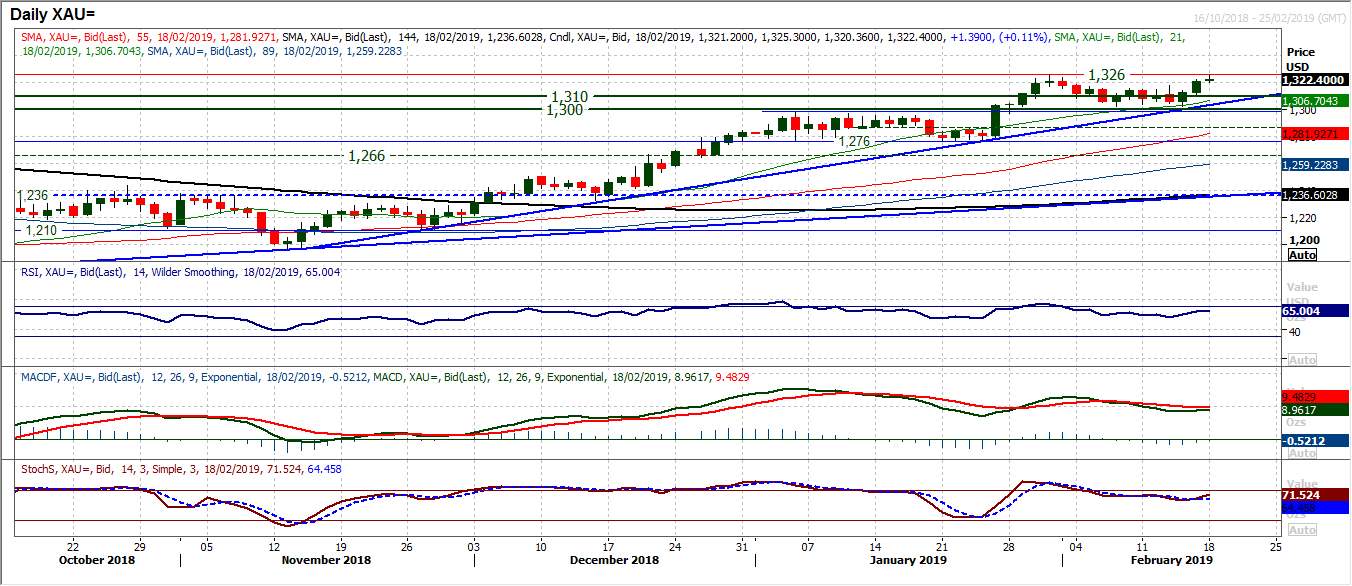
Gold
The support in the long term pivot band $1300/$1310 has held firm and the bulls are looking to push forward in the range once more. For two weeks there has been a tight consolidation above $1302 but failing around $1316, but there was a decisive shift in sentiment on Friday with a move to close above $1316, whilst the deterioration in momentum indicators has been contained. The hourly chart shows the market trading above the hourly moving averages whilst pushing a more positive configuration on momentum. A test of the upper reaches of the consolidation at $1326 is now on. Corrections also now become a chance to buy in the range, with the support of the top of the long term pivot $1300/$1310 acting as a basis of support on Friday. The uptrend which is now into its 13th week is supportive at $1303 now which is above the $1302 recent reaction low. Above $1326 re-opens the upside towards the $1366 highs again.
WTI Oil
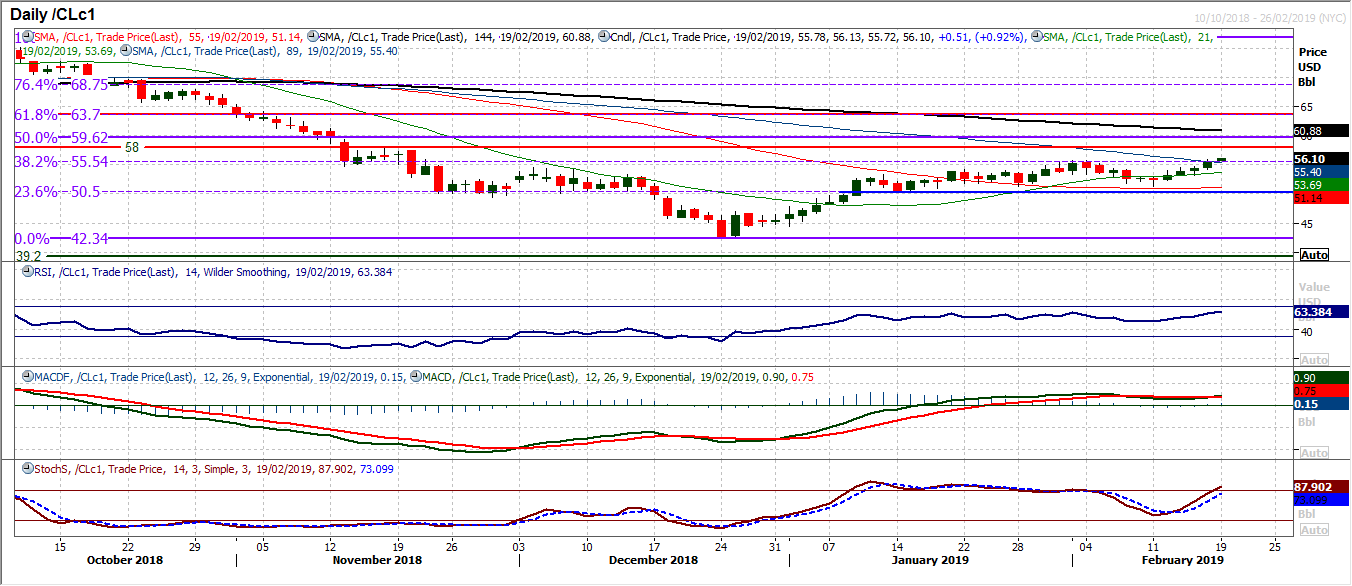
WTI is following Brent Crude in a break to multi month highs. A two day close above $55.75 would now complete a three month base pattern which would imply around $12 of upside over the medium term. This move would though immediately imply a range breakout of around $5 upside as the first target. The momentum indicators confirming the move is also strong, with the RSI above 60, MACD lines ticking higher again, whilst the Stochastics accelerating higher reflect the strength of the near term move. The first resistance is the old pivot at $58.00, whilst a decisive trade clear of the 38.2% Fib level at $55.55 opens the 50% Fib at $59.62. The hourly chart shows higher lows and weakness being bought into, with a basis of support between $54.25/$55.00.
Dow Jones Industrial Average
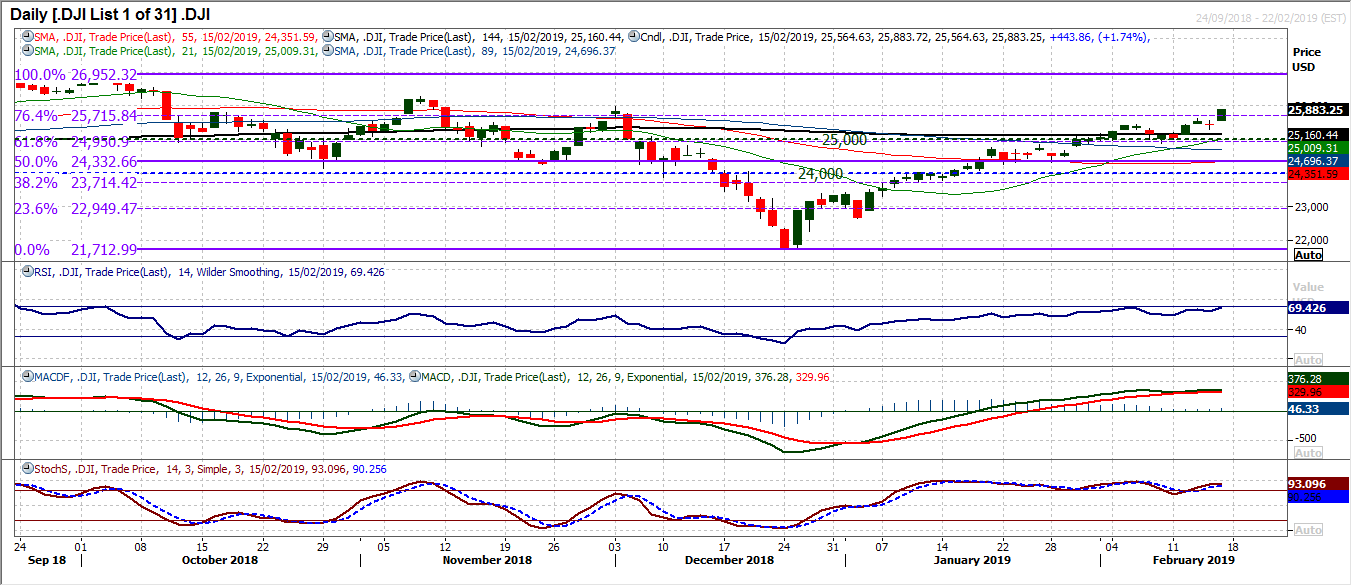
Intraday corrections continue to be a chance to buy for the Dow. Another mild slip was bought into to end the week on a high note and a strongly impressive bull candle. Solid buying from start to the finish of the session on Friday closed the market at its highest since early December. A move through the 76.4% Fibonacci retracement (at 25,715) also means that should the market get through the December high of 25,980 there is good traction in this rally for potentially a full retracement. Momentum indicators are strong with the move, but it will be interesting to see how the market responds with the RSI all but around 70. Of all the rallies in the past year, only once has the RSI moved above 70. This could lead to a stalling of the rally potentially in the coming days. Below the 76.4% Fib (at 25,715) which is now a consolidation point, the support is at 25,310/25,440.
Author

Richard Perry
Independent Analyst


