USD/JPY 1H Chart: Channel Down
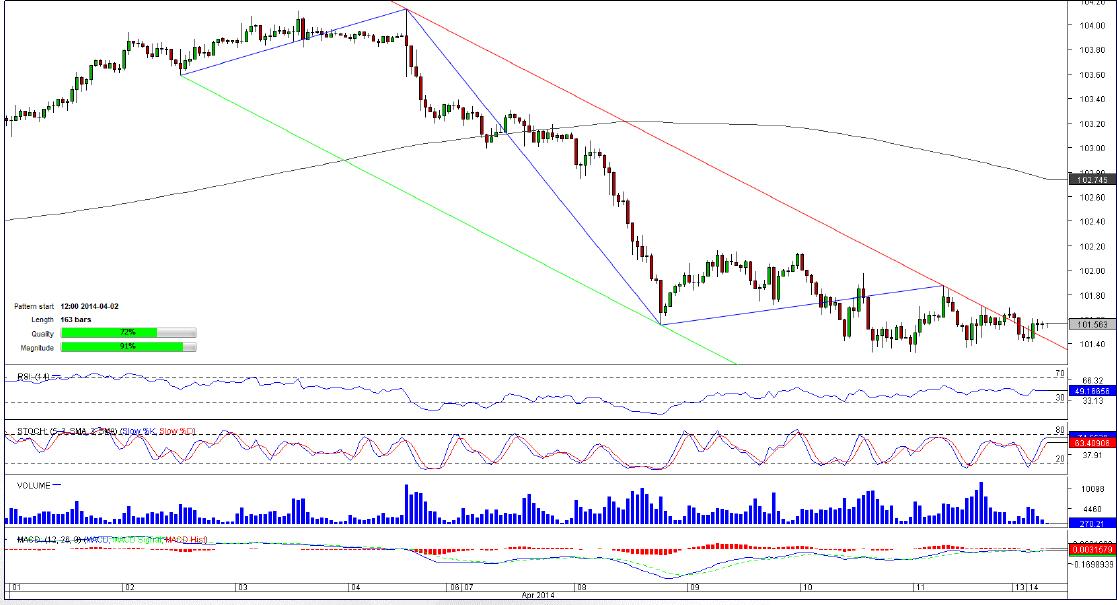
Comment: USD/JPY commenced a retreat at a three-month high of 104.12 attained in the very beginning of April. The decline has been being performed in the 163-bar long bearish corridor that pushed the pair to a three-week low two days earlier.
Now the instrument is on the brink of breaking out of the tunnel as it has already overcome the pattern’s resistance and now only two levels 101.57/9 (50-hour SMA, daily S1) and 101.74/82 (daily S2, S3) are capable to contain a sharp appreciation that usually follows a bullish breakout from a trading pattern. According to the SWFX data, traders are in favour of the rally-almost 70% of all orders are placed to buy the pair.
XAU/USD 1H Chart: Ascending Triangle
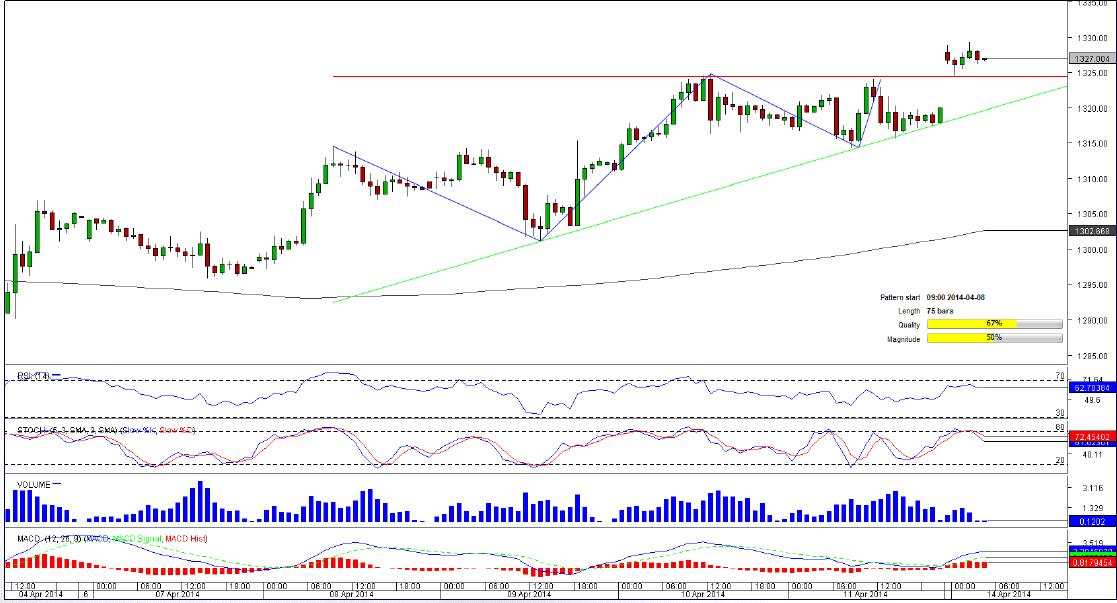
Comment: After losing its value relative to the U.S. Dollar during more than two weeks ended April 1, the most traded precious metal started to appreciate. Although the rally has been lasting for almost two weeks, the yellow metal is not likely to halt it in the nearest future given that gold opened above the upper limit of the 75-bar long ascending triangle. This may mean that the breakout might have occurred. Market players support this idea, betting on appreciation of the metal in 67.80% of cases. Technical indicators also signal that buying pressure may be in place in the short-term.
AUD/JPY 1H Chart: Descending Triangle
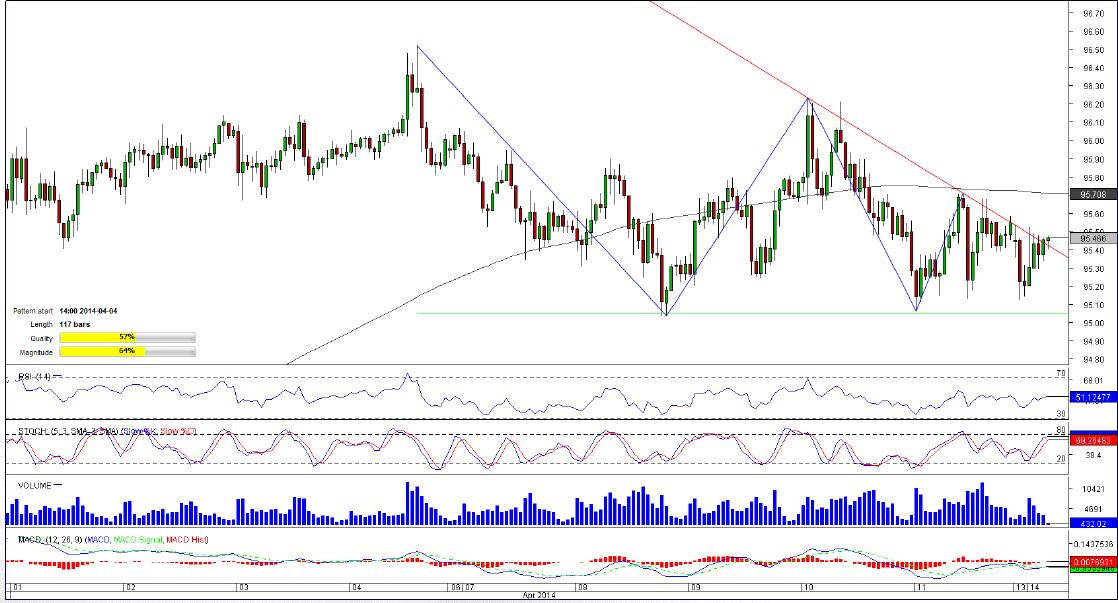
Comment: Since mid-March the Australian Dollar has been on the rise against the Japanese Yen and the pair is not likely to cease its advance in the hours to come since the descending triangle pattern formed early April seems to have failed to contain the pair’s climb. If the pair succeeds in consolidating above the triangle boundary, it is likely to witness an accelerating advance that may push it above the 50-and 200-hour SMAs, meandering at 95.52 and 95.70. The bullish scenario is also bolstered by the SWFX numbers, showing that 73% of market participants expect AUD/JPY to gain in the foreseeable future.
USD/HKD 1H Chart: Falling Wedge
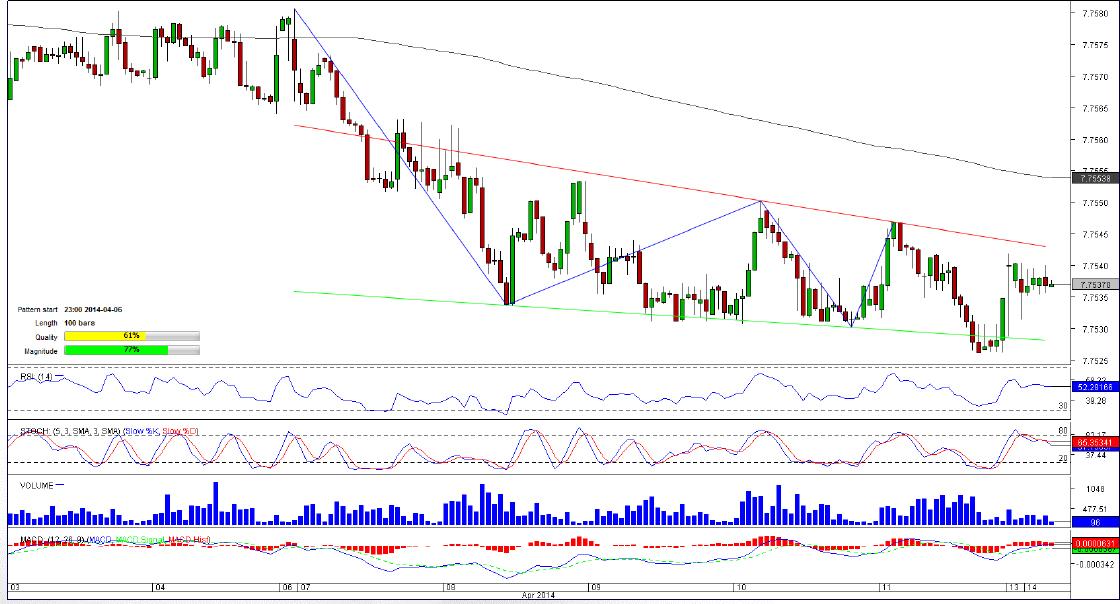
Comment: A jump to a six-week high of 7.7677 in the second part of March provoked a massive sell-off of USD/HKD that had lost almost a hundred pips before it slowed down the pace of decline and entered a falling wedge pattern that now is circa 100-bar long.
At the moment, the pair is sitting slightly above the short-term SMA at 7.7536 and may try to bounce off this mark before long as technical indicators point to a possible rally in the nearest term but at the same time the data warns of a potential decline in the longer perspective.
This overview can be used only for informational purposes. Dukascopy SA is not responsible for any losses arising from any investment based on any recommendation, forecast or other information herein contained.
Recommended Content
Editors’ Picks
USD/JPY crashes nearly 450 pips to 155.50 on likely Japanese intervention

Having briefly recaptured 160.00, USD/JPY came under intense selling to test 155.00 on what seems like a Japanese FX intervention underway. The Yen tumbled in early trades amid news that Japan's PM lost 3 key seats in the by-election. Holiday-thinned trading exaggerates the USD/JPY price action.
AUD/USD rallies toward 0.6600 on risk flows, hawkish RBA expectations

AUD/USD extends gains toward 0.6600 in the Asian session on Monday. The Aussie pair is underpinned by increased bets of an RBA rate hike at its May policy meeting after the previous week's hot Australian CPI data. Risk flows also power the pair's upside.
Gold tests critical daily support line, will it defend?

Gold price is seeing a negative start to a new week on Monday, having booked a weekly loss. Gold price bears the brunt of resurgent US Dollar (USD) demand and a risk-on market mood amid Japanese holiday-thinned market conditions.
Ethereum fees drops to lowest level since October, ETH sustains above $3,200

Ethereum’s high transaction fees has been a sticky issue for the blockchain in the past. This led to Layer 2 chains and scaling solutions developing alternatives for users looking to transact at a lower cost.
Week ahead: Hawkish risk as Fed and NFP on tap, Eurozone data eyed too

Fed meets on Wednesday as US inflation stays elevated. Will Friday’s jobs report bring relief or more angst for the markets? Eurozone flash GDP and CPI numbers in focus for the Euro.


