The ES loves stimulus and predictability

The pessimists are getting squeezed to their core, the optimists are gleefully complacent. This probably won't end well.
A recent article in Barron's was a great reminder that the markets move higher or lower (mostly) without regard to who occupies the White House. It is hard to argue the reigning party plays no part in the direction of stocks but it can be argued that it merely enhances movements rather than dictates them.
For any living and breathing human with an inherent bias, this is a tough pill to swallow but the data suggests it is the case. Further, the effects of economic and monetary policy influencing the economy and stock market generally take years to materialize. Often, the policies one leader enacts during his Presidental run are merely kicking in when he leaves office and the cycle repeats itself. In short, making buy or sell decisions based on elections and parties in power is a difficult game.
Imagine what it might have felt like to liquidate your stock portfolio immediately after the 2016 election because conventional wisdom suggested President Trump would be chaotic and uncertain. Likewise, I have seen and heard the chatter of aggressive shorts in the market who assumed the high tax and increased regulation legacy of President Biden would lead to market turmoil. Thus far, that outlook has been incorrect. Instead, the market is focused on stimulus.
That said, for reasons other than political, there are good arguments for a potential sell-off in the S&P 500 (seasonals are rocky in the coming weeks, squeezing out the bears will work against momentum, sky-high multiples, and a potential reversal in the dollar).
On a side note, I am looking forward to an environment in which we can issue bullish or bearish opinions on stocks and commodities without being painted into a political corner. During the Trump era, being bullish on stocks was seen as supporting the President, and vice versa. As someone who has been writing about markets for well over a decade(through the financial crisis, the credit rating crisis, etc.), receiving such feedback on social media and in emails was a bit of a shock. Let's hope we enter a period of less emotion.
Treasury Futures Markets
30-year Treasury Bond Futures
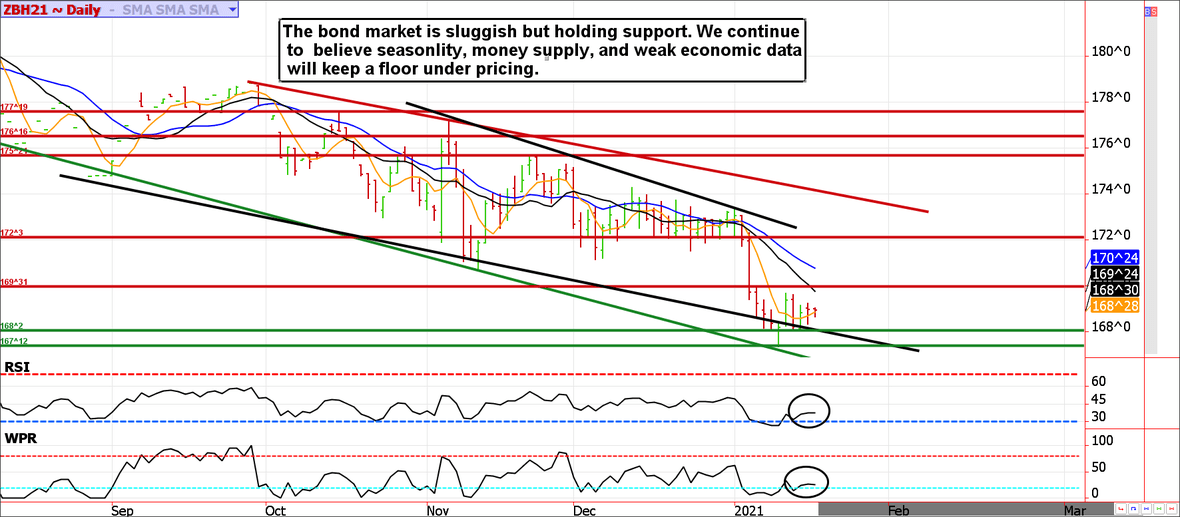
Treasuries have been selling off on stimulus talk, but the market might have it wrong.
The financial markets have been associating stimulus money with higher stocks, a better economy, and lower Treasuries (higher yields). But there is another view; in 2008/2009 the onset of Quantitative Easing enabled ALL assets to rally. Treasuries were not an exception. In fact, the bond and note markets moved higher despite wildly improving fundamentals.
We have to wonder if some of the money sloshing around pushing Tesla shares and Bitcoin wildly higher will eventually look for something less speculative such as Treasuries. Further, as mentioned in a recent DeCarley Perspective, the 10-year note yield is now competitive with the dividend yield of the S&P 500 and there are supposedly plenty of foreign buyers eager to earn 1% in the fixed income market (such as yield is not possible anywhere else in the world without taking on substantially more risk).
Treasury futures market consensus:
Despite the recent probe lower, we believe the Treasury market is forming a base and will move higher in the coming weeks/months.
Technical Support: ZB: 168'02 and 167'11 ZN: 136'11 and 136'01
Technical Resistance: ZB: 169'30, 172'03, 175'21, 176'16, 177'19 ZN: 137'10, 138'21, 139'03
Stock Index Futures
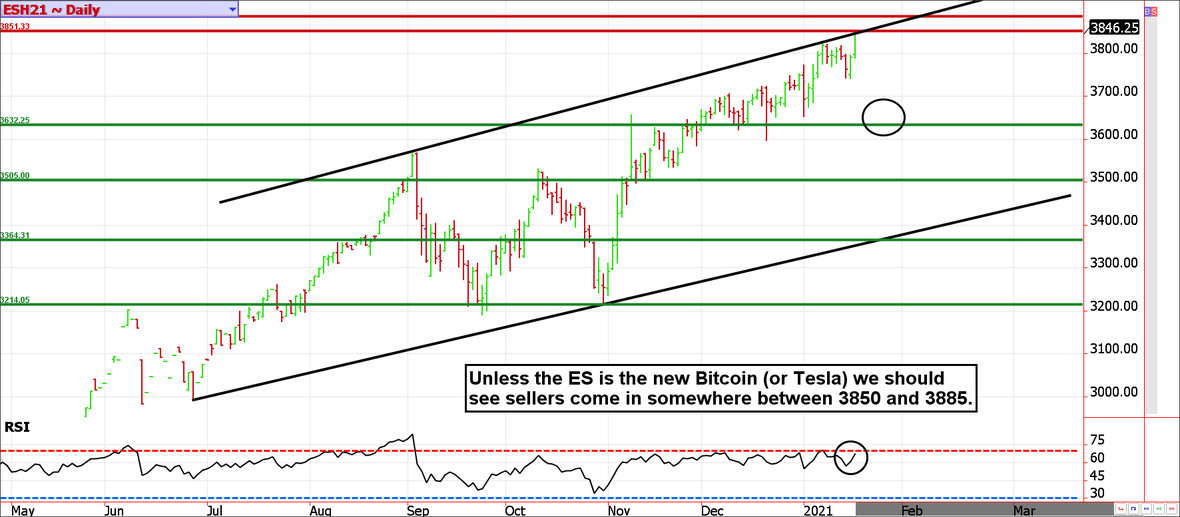
Stock speculation is off-the-charts crazy.
Picking a top in the equity market is nearly impossible, but a correction is likely imminent. Unfortunately, there is no limit to crazy.
We would never suggest blindly selling futures against the longest and fastest rally in history, but expecting a shift in sentiment and volatility is certainly prudent. It is common to see the broad market melt-up from November through January but things have a tendency to get rocky from there. Knowing when and where is the hard part.
If you are a put option seller, this is a good time to pat yourself on the back and reduce risk. If you are holding painful bearish positions, keep hedges in place (sell puts against short futures and maybe even buy a call or two)but give it some time.
If you follow me on Twitter (@carleygarner), you've likely seen some of the "investment" videos and comments I have shared from younger market participants. One, in particular, made the claim: "there is no need to work, you can make living trading stock options by getting in when the stock starts to go up and then getting out as soon as it starts to go down." This is not healthy or sustainable, things are eventually going to get very interesting.
Stock index futures market consensus:
There is a band of resistance between 3850 and 3885, if the bears have a chance, this area must hold.
Technical Support: 3630, 3505, 3360, and 3214
Technical Resistance: 3855 and 3885
E-mini S&P Futures Day Trading Levels
These are counter-trend entry ideas, the more distant the level the more reliable but the less likely to get filled
ES Day Trade Sell Levels: 3853 and 3883
ES Day Trade Buy Levels: 3775, 3730, 3665, 3622, 3596, and 3505
In other commodity futures and options markets...
August 31 - Buy January soybean 9.40 put and sell the 9.0 put for about 14 cents.
September 17 - Buy back short leg of soybean put spread.
October 8 - Buy March corn $3.80 put.
November 11 - Buy March 3400/3200/3000 put fly for about 13 points.
November 20 - Buy February Copper 3.10/3.20 put spread.
November 20 - Buy March sugar 14.25 put
November 23 - Buy March soybean 11.00 put.
December 7 - Buy the March wheat 5.80/6.10 call spread.
December 11 - Buy March 45/42 crude oil put spread.
January 4 - Go short the BCI (Bloomberg Commodity Index) near 78.6.
January 12 - Buy Feb ZN 136.50 call near 11 ticks.
January 15 - Sell Feb ZN 136.50 call near 28 ticks.
January 15 - Buy May ZN 136/137.50 call spread near 38 ticks.
January 15 - Buy May wheat 6.50/6.10 put spread near 15.5 cents.
A recent article in Barron's was a great reminder that the markets move higher or lower (mostly) without regard to who occupies the White House. It is hard to argue the reigning party plays no part in the direction of stocks but it can be argued that it merely enhances movements rather than dictates them.
For any living and breathing human with an inherent bias, this is a tough pill to swallow but the data suggests it is the case. Further, the effects of economic and monetary policy influencing the economy and stock market generally take years to materialize. Often, the policies one leader enacts during his Presidental run are merely kicking in when he leaves office and the cycle repeats itself. In short, making buy or sell decisions based on elections and parties in power is a difficult game.
Imagine what it might have felt like to liquidate your stock portfolio immediately after the 2016 election because conventional wisdom suggested President Trump would be chaotic and uncertain. Likewise, I have seen and heard the chatter of aggressive shorts in the market who assumed the high tax and increased regulation legacy of President Biden would lead to market turmoil. Thus far, that outlook has been incorrect. Instead, the market is focused on stimulus.
That said, for reasons other than political, there are good arguments for a potential sell-off in the S&P 500 (seasonals are rocky in the coming weeks, squeezing out the bears will work against momentum, sky-high multiples, and a potential reversal in the dollar).
On a side note, I am looking forward to an environment in which we can issue bullish or bearish opinions on stocks and commodities without being painted into a political corner. During the Trump era, being bullish on stocks was seen as supporting the President, and vice versa. As someone who has been writing about markets for well over a decade(through the financial crisis, the credit rating crisis, etc.), receiving such feedback on social media and in emails was a bit of a shock. Let's hope we enter a period of less emotion.
Treasury Futures Markets
30-year Treasury Bond Futures
Treasuries have been selling off on stimulus talk, but the market might have it wrong.
The financial markets have been associating stimulus money with higher stocks, a better economy, and lower Treasuries (higher yields). But there is another view; in 2008/2009 the onset of Quantitative Easing enabled ALL assets to rally. Treasuries were not an exception. In fact, the bond and note markets moved higher despite wildly improving fundamentals.
We have to wonder if some of the money sloshing around pushing Tesla shares and Bitcoin wildly higher will eventually look for something less speculative such as Treasuries. Further, as mentioned in a recent DeCarley Perspective, the 10-year note yield is now competitive with the dividend yield of the S&P 500 and there are supposedly plenty of foreign buyers eager to earn 1% in the fixed income market (such as yield is not possible anywhere else in the world without taking on substantially more risk).
Treasury futures market consensus:
Despite the recent probe lower, we believe the Treasury market is forming a base and will move higher in the coming weeks/months.
Technical Support: ZB: 168'02 and 167'11 ZN: 136'11 and 136'01
Technical Resistance: ZB: 169'30, 172'03, 175'21, 176'16, 177'19 ZN: 137'10, 138'21, 139'03
Stock Index Futures
Stock speculation is off-the-charts crazy.
Picking a top in the equity market is nearly impossible, but a correction is likely imminent. Unfortunately, there is no limit to crazy.
We would never suggest blindly selling futures against the longest and fastest rally in history, but expecting a shift in sentiment and volatility is certainly prudent. It is common to see the broad market melt-up from November through January but things have a tendency to get rocky from there. Knowing when and where is the hard part.
If you are a put option seller, this is a good time to pat yourself on the back and reduce risk. If you are holding painful bearish positions, keep hedges in place (sell puts against short futures and maybe even buy a call or two)but give it some time.
If you follow me on Twitter (@carleygarner), you've likely seen some of the "investment" videos and comments I have shared from younger market participants. One, in particular, made the claim: "there is no need to work, you can make living trading stock options by getting in when the stock starts to go up and then getting out as soon as it starts to go down." This is not healthy or sustainable, things are eventually going to get very interesting.
Stock index futures market consensus:
There is a band of resistance between 3850 and 3885, if the bears have a chance, this area must hold.
Technical Support: 3630, 3505, 3360, and 3214
Technical Resistance: 3855 and 3885
E-mini S&P Futures Day Trading Levels
These are counter-trend entry ideas, the more distant the level the more reliable but the less likely to get filled
ES Day Trade Sell Levels: 3853 and 3883
ES Day Trade Buy Levels: 3775, 3730, 3665, 3622, 3596, and 3505
In other commodity futures and options markets...
August 31 - Buy January soybean 9.40 put and sell the 9.0 put for about 14 cents.
September 17 - Buy back short leg of soybean put spread.
October 8 - Buy March corn $3.80 put.
November 11 - Buy March 3400/3200/3000 put fly for about 13 points.
November 20 - Buy February Copper 3.10/3.20 put spread.
November 20 - Buy March sugar 14.25 put
November 23 - Buy March soybean 11.00 put.
December 7 - Buy the March wheat 5.80/6.10 call spread.
December 11 - Buy March 45/42 crude oil put spread.
January 4 - Go short the BCI (Bloomberg Commodity Index) near 78.6.
January 12 - Buy Feb ZN 136.50 call near 11 ticks.
January 15 - Sell Feb ZN 136.50 call near 28 ticks.
January 15 - Buy May ZN 136/137.50 call spread near 38 ticks.
January 15 - Buy May wheat 6.50/6.10 put spread near 15.5 cents.
Author

Carley Garner
DeCarley Trading
Carley Garner is an experienced commodity broker with DeCarley Trading, a division of Zaner, in Las Vegas, Nevada. She is also the author of multiple books including, “Higher Probability Commodity Trading” and “A Trader's First Book on Commodities”.
More from Carley Garner


